|
|
 |
|
Investment Objective/Strategy - The First Trust Financials AlphaDEX® Fund is an exchange-traded fund. The investment objective of the Fund is to seek investment results that correspond generally to the price and yield, before fees and expenses, of an equity index called the StrataQuant® Financials Index.
There can be no assurance that the Fund's investment objectives will be achieved.
- The StrataQuant® Financials Index is an "enhanced" index developed, maintained and sponsored by ICE Data Indices, LLC or its affiliates ("IDI") which employs the AlphaDEX® stock selection methodology to select stocks from the Russell 1000® Index.
- IDI constructs the StrataQuant® Financials Index by ranking the stocks which are members of the Russell 1000® Index on growth factors including three, six and 12-month price appreciation, sales to price and one year sales growth, and, separately, on value factors including book value to price, cash flow to price and return on assets. All stocks are ranked on the sum of ranks for the growth factors and, separately, all stocks are ranked on the sum of ranks for the value factors.
- Each stock receives either its growth or value score rank as its selection score based on its style designation as determined by Russell. Stocks which Russell allocates between both growth and value receive the better of their growth or value score rank as their selection score.
- IDI then ranks those stocks contained in the financials sector according to their score. The greater of the top 75% of the eligible universe or 40 stocks is selected for the StrataQuant® Financials Index.
- If the total count of eligible stocks in the financials sector falls below 40, all eligible stocks will be included.
- The selected stocks are divided into quintiles based on their rankings and the top ranked quintiles receive a higher weight within the index. The stocks are equally-weighted within each quintile.
- The index is reconstituted and rebalanced quarterly.
| Ticker | FXO |
| Fund Type | Financials |
| Investment Advisor | First Trust Advisors L.P. |
| Investor Servicing Agent | Bank of New York Mellon Corp |
| CUSIP | 33734X135 |
| ISIN | US33734X1357 |
| Intraday NAV | FXOIV |
| Fiscal Year-End | 07/31 |
| Exchange | NYSE Arca |
| Inception | 5/8/2007 |
| Inception Price | $20.00 |
| Inception NAV | $20.00 |
| Rebalance Frequency | Quarterly |
| Total Expense Ratio* | 0.60% |
| Net Expense Ratio* | 0.60% |
* As of 12/1/2025
Expenses are capped contractually at 0.70% per year, at least through November 30, 2026.
| Closing NAV1 | $63.97 |
| Closing Market Price2 | $63.95 |
| Bid/Ask Midpoint | $63.96 |
| Bid/Ask Discount | 0.02% |
| 30-Day Median Bid/Ask Spread3 | 0.08% |
| Total Net Assets | $1,087,428,680 |
| Outstanding Shares | 17,000,002 |
| Daily Volume | 52,651 |
| Average 30-Day Daily Volume | 57,963 |
| Closing Market Price 52-Week High/Low | $63.95 / $54.46 |
| Closing NAV 52-Week High/Low | $63.97 / $54.48 |
| Number of Holdings (excluding cash) | 105 |
| Holding |
Percent |
| T. Rowe Price Group, Inc. |
1.83% |
| The Hanover Insurance Group, Inc. |
1.78% |
| Affiliated Managers Group, Inc. |
1.73% |
| Cincinnati Financial Corporation |
1.70% |
| The Allstate Corporation |
1.68% |
| SEI Investments Company |
1.62% |
| FactSet Research Systems Inc. |
1.60% |
| First American Financial Corporation |
1.60% |
| Everest Group, Ltd. |
1.58% |
| Axis Capital Holdings Limited |
1.56% |
* Excluding cash.
Holdings are subject to change.
Past performance is not indicative of future results.
| Maximum Market Cap. | $1,078,391 |
| Median Market Cap. | $13,874 |
| Minimum Market Cap. | $1,587 |
| Price/Earnings | 10.84 |
| Price/Book | 1.44 |
| Price/Cash Flow | 9.30 |
| Price/Sales | 1.77 |
|
|
2025 |
Q1 2026 |
Q2 2026 |
Q3 2026 |
| Days Traded at Premium |
124 |
21 |
23 |
1 |
| Days Traded at Discount |
126 |
40 |
39 |
1 |
|
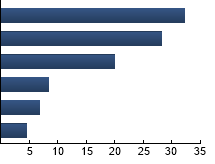
Non-life Insurance
|
32.15%
|
|
Banks
|
28.17%
|
|
Investment Banking and Brokerage Services
|
19.87%
|
|
Finance and Credit Services
|
8.39%
|
|
Life Insurance
|
6.80%
|
|
Mortgage Real Estate Investment Trusts
|
4.62%
|
|
|
Tracking Index: StrataQuant® Financials Index
| |
Standard Deviation |
Alpha |
Beta |
Sharpe Ratio |
Correlation |
| FXO |
17.85% |
-0.10 |
1.15 |
0.92 |
0.94 |
| S&P 500® Financials Index |
14.61% |
--- |
1.00 |
0.99 |
1.00 |
Standard Deviation is a measure of price variability (risk). Alpha is an indication of how much an investment outperforms or underperforms
on a risk-adjusted basis relative to its benchmark.Beta is a measure of price variability relative to the market. Sharpe Ratio is a measure
of excess reward per unit of volatility. Correlation is a measure of the similarity of performance.
Russell 1000® Financials Index - The Index is an unmanaged index which includes the stocks in the financial services sector of the Russell 1000® Index. Russell 1000® Index - The Index is an unmanaged index used to measure the large-cap U.S. equity universe. Russell 3000® Index - The Index is comprised of the 3000 largest and most liquid stocks based and traded in the U.S. S&P 500® Financials Index - The Index is an unmanaged index which includes the stocks in the financial sector of the S&P 500 Index.
|
|
The information presented is not intended to constitute an investment recommendation for, or advice to, any specific person. By providing this information, First Trust is not undertaking to give advice in any fiduciary capacity within the meaning of ERISA, the Internal Revenue Code or any other regulatory framework. Financial professionals are responsible for evaluating investment risks independently and for exercising independent judgment in determining whether investments are appropriate for their clients.
|