|
|
 |
|
Investment Objective/Strategy - The First Trust Dow Jones Select MicroCap Index Fund is an exchange-traded index fund. The investment objective of the Fund is to replicate as closely as possible, before fees and expenses, the price and yield of the Dow Jones Select Microcap IndexSM.
There can be no assurance that the Fund's investment objectives will be achieved.
-
This index is designed to represent microcap stocks trading on the New York Stock Exchange ("NYSE"), NYSE Amex and Nasdaq that are comparatively liquid and have strong fundamentals relative to the microcap segment as a whole.
-
Covers securities whose market capitalizations fall within a range defined by the bottom two deciles of NYSE stocks.
-
Stocks are screened based on market capitalization, trading volume, and financial indicators that include trailing price/earnings ratio, trailing price/sales ratio, per-share profit change for the previous quarter, operating profit margin and six-month total return.
| Ticker | FDM |
| Fund Type | Micro Cap |
| Investment Advisor | First Trust Advisors L.P. |
| Investor Servicing Agent | Bank of New York Mellon Corp |
| CUSIP | 33718M105 |
| ISIN | US33718M1053 |
| Intraday NAV | FDMIV |
| Fiscal Year-End | 12/31 |
| Exchange | NYSE Arca |
| Inception | 9/27/2005 |
| Inception Price | $20.00 |
| Inception NAV | $20.00 |
| Rebalance Frequency | Quarterly |
| Total Expense Ratio* | 0.65% |
| Net Expense Ratio* | 0.60% |
* As of 5/1/2026
Expenses are capped contractually at 0.60% per year, at least through April 30, 2027.
| Closing NAV1 | $92.47 |
| Closing Market Price2 | $92.48 |
| Bid/Ask Midpoint | $92.53 |
| Bid/Ask Premium | 0.06% |
| 30-Day Median Bid/Ask Spread3 | 0.11% |
| Total Net Assets | $263,991,929 |
| Outstanding Shares | 2,855,000 |
| Daily Volume | 10,831 |
| Average 30-Day Daily Volume | 8,351 |
| Closing Market Price 52-Week High/Low | $93.77 / $69.04 |
| Closing NAV 52-Week High/Low | $93.66 / $69.04 |
| Number of Holdings (excluding cash) | 148 |
| Holding |
Percent |
| Stoke Therapeutics, Inc. |
2.30% |
| NWPX Infrastructure, Inc. |
1.66% |
| TETRA Technologies, Inc. |
1.58% |
| Dauch Corporation |
1.53% |
| United Fire Group, Inc. |
1.49% |
| Douglas Dynamics, Inc. |
1.46% |
| USA TODAY Co., Inc. |
1.41% |
| Deluxe Corporation |
1.40% |
| Universal Insurance Holdings, Inc. |
1.36% |
| American Public Education, Inc. |
1.31% |
* Excluding cash.
Holdings are subject to change.
Past performance is not indicative of future results.
 Among 461 funds in the Small Value category. This fund was rated 4 stars/461 funds (3 years), 4 stars/438 funds (5 years), 4 stars/364 funds (10 years) based on risk adjusted returns.
| Maximum Market Cap. | $2,489 |
| Median Market Cap. | $643 |
| Minimum Market Cap. | $23 |
| Price/Earnings | 13.14 |
| Price/Book | 1.51 |
| Price/Cash Flow | 8.84 |
| Price/Sales | 0.87 |
|
|
2025 |
Q1 2026 |
Q2 2026 |
Q3 2026 |
| Days Traded at Premium |
114 |
37 |
41 |
2 |
| Days Traded at Discount |
136 |
24 |
21 |
0 |
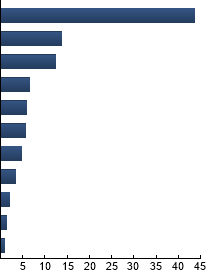
|
Financials
|
43.60%
|
|
Industrials
|
13.70%
|
|
Consumer Discretionary
|
12.47%
|
|
Health Care
|
6.57%
|
|
Energy
|
5.74%
|
|
Information Technology
|
5.59%
|
|
Consumer Staples
|
4.77%
|
|
Communication Services
|
3.32%
|
|
Materials
|
1.92%
|
|
Real Estate
|
1.38%
|
|
Utilities
|
0.94%
|
|
|
Tracking Index: Dow Jones Select MicroCap IndexSM
| |
Standard Deviation |
Alpha |
Beta |
Sharpe Ratio |
Correlation |
| FDM |
19.81% |
2.37 |
0.89 |
0.83 |
0.91 |
| Russell 2000® Index |
20.31% |
--- |
1.00 |
0.79 |
1.00 |
Standard Deviation is a measure of price variability (risk). Alpha is an indication of how much an investment outperforms or underperforms
on a risk-adjusted basis relative to its benchmark.Beta is a measure of price variability relative to the market. Sharpe Ratio is a measure
of excess reward per unit of volatility. Correlation is a measure of the similarity of performance.
Russell 2000® Index - The Index is comprised of the smallest 2000 companies in the Russell 3000 Index. Russell 3000® Index - The Index is comprised of the 3000 largest and most liquid stocks based and traded in the U.S.
|
|
The information presented is not intended to constitute an investment recommendation for, or advice to, any specific person. By providing this information, First Trust is not undertaking to give advice in any fiduciary capacity within the meaning of ERISA, the Internal Revenue Code or any other regulatory framework. Financial professionals are responsible for evaluating investment risks independently and for exercising independent judgment in determining whether investments are appropriate for their clients.
|