|
|
 |
|
Investment Objective/Strategy - The Multi-Asset Diversified Income Index Fund is an exchange-traded fund. The investment objective of the Fund is to seek investment results that correspond generally to the price and yield, before the Fund's fees and expenses, of an index called the Nasdaq US Multi-Asset Diversified Income™ Index.
There can be no assurance that the Fund's investment objectives will be achieved.
- The Index is a modified market capitalization-weighted index designed to provide exposure to multiple asset segments, each selected to result in a consistent and high yield for the index. The Index is comprised of securities classified as equities (20%), real estate investment trusts (REITs) (20%), preferred securities (20%), master limited partnerships (MLPs) (20%) and a high yield corporate debt ETF (20%).
- Each segment has its own set of eligibility criteria.
- Every security in the Index is U.S.-listed and meets stringent eligibility criteria based on liquidity, size, volatility and yield.
- The Index is rebalanced quarterly.
Fund Description
- The fund will normally invest at least 90% of its net assets (plus the amount of any borrowings for investment purposes) in the common stocks and/or depositary receipts, REITs, preferred securities, MLPs and an ETF that comprise each segment of the index.
- The percentages provided above in the Index Description reflect the approximate percentages of each of the index segments included in the index as of each quarterly rebalance. The percentages will vary from these amounts between rebalances of the index.
| Ticker | MDIV |
| Fund Type | Multi Asset Income |
| Investment Advisor | First Trust Advisors L.P. |
| Investor Servicing Agent | Bank of New York Mellon Corp |
| CUSIP | 33738R100 |
| ISIN | US33738R1005 |
| Intraday NAV | MDIVIV |
| Fiscal Year-End | 09/30 |
| Exchange | Nasdaq |
| Inception | 8/13/2012 |
| Inception Price | $19.98 |
| Inception NAV | $19.98 |
| Rebalance Frequency | Quarterly |
| Total Expense Ratio* | 0.83% |
| Net Expense Ratio* | 0.71% |
* As of 2/2/2026
First Trust has contractually agreed to reduce management fees earned by the fund for management fees due to be paid to the underlying investment companies advised by First Trust. The agreement is expected to remain in place until at least January 31, 2027, or until its termination at the direction of the Trust's Board of Trustees, or the termination of the Investment Management Agreement. Please see the Fees and Expenses of the Fund section in the fund's prospectus for more details.
| Closing NAV1 | $16.61 |
| Closing Market Price2 | $16.61 |
| Bid/Ask Midpoint | $16.62 |
| Bid/Ask Premium | 0.03% |
| 30-Day Median Bid/Ask Spread3 | 0.30% |
| Total Net Assets | $419,442,649 |
| Outstanding Shares | 25,250,002 |
| Daily Volume | 33,453 |
| Average 30-Day Daily Volume | 65,316 |
| Closing Market Price 52-Week High/Low | $16.76 / $15.59 |
| Closing NAV 52-Week High/Low | $16.73 / $15.61 |
| Number of Holdings (excluding cash) | 124 |
| Holding |
Percent |
| First Trust Tactical High Yield ETF |
19.57% |
| AGNC Investment Corp. |
1.61% |
| PennyMac Mortgage Investment Trust |
1.59% |
| MFA Financial, Inc. |
1.55% |
| Icahn Enterprises, L.P. |
1.53% |
| Annaly Capital Management, Inc. |
1.48% |
| Mach Natural Resources LP |
1.48% |
| TXO Partners, L.P. |
1.47% |
| Rithm Capital Corp. |
1.17% |
| CrossAmerica Partners LP |
1.13% |
* Excluding cash.
Holdings are subject to change.
Past performance is not indicative of future results.
| Maximum Market Cap. | $281,959 |
| Median Market Cap. | $8,235 |
| Minimum Market Cap. | $691 |
| Price/Earnings | 14.51 |
| Price/Book | 1.52 |
| Price/Cash Flow | 8.64 |
| Price/Sales | 1.15 |
|
|
2025 |
Q1 2026 |
Q2 2026 |
Q3 2026 |
| Days Traded at Premium |
150 |
22 |
49 |
2 |
| Days Traded at Discount |
100 |
39 |
13 |
0 |
|
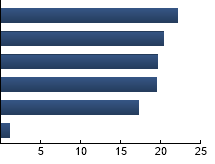
Dividend Paying Equities
|
22.17%
|
|
REITS
|
20.34%
|
|
High Yield Corporate Bond ETFs
|
19.68%
|
|
Preferred Securities
|
19.53%
|
|
MLPs
|
17.19%
|
|
Other
|
1.09%
|
|
|
Tracking Index: Nasdaq US Multi-Asset Diversified Income™ Index
| |
Standard Deviation |
Alpha |
Beta |
Sharpe Ratio |
Correlation |
| MDIV |
8.58% |
0.35 |
0.40 |
0.86 |
0.62 |
| Dow Jones U.S. Select Dividend Index |
13.16% |
1.91 |
0.59 |
0.94 |
0.60 |
| S&P 500® Index |
13.27% |
--- |
1.00 |
1.33 |
1.00 |
Standard Deviation is a measure of price variability (risk). Alpha is an indication of how much an investment outperforms or underperforms
on a risk-adjusted basis relative to its benchmark.Beta is a measure of price variability relative to the market. Sharpe Ratio is a measure
of excess reward per unit of volatility. Correlation is a measure of the similarity of performance.
Dow Jones U.S. Select Dividend Index - The Index consists of 100 widely-traded, dividend-paying stocks derived from the Dow Jones U.S.Total Market IndexSM. S&P 500® Index - The Index is an unmanaged index of 500 companies used to measure large-cap U.S. stock market performance.
|
|
The information presented is not intended to constitute an investment recommendation for, or advice to, any specific person. By providing this information, First Trust is not undertaking to give advice in any fiduciary capacity within the meaning of ERISA, the Internal Revenue Code or any other regulatory framework. Financial professionals are responsible for evaluating investment risks independently and for exercising independent judgment in determining whether investments are appropriate for their clients.
|