|
|
 |
|
Investment Objective/Strategy - The First Trust Institutional Preferred Securities and Income ETF is an actively managed exchange-traded fund. The fund's investment objective is to seek total return and to provide current income. Under normal market conditions, the Fund invests at least 80% of its net assets (including investment borrowings) in institutional preferred securities and income-producing debt securities.
There can be no assurance that the Fund's investment objectives will be achieved.
| Ticker | FPEI |
| Fund Type | Preferred Income |
| Investment Advisor | First Trust Advisors L.P. |
| Investor Servicing Agent | Bank of New York Mellon Corp |
| Portfolio Manager/Sub-Advisor | Stonebridge Advisors LLC |
| CUSIP | 33739P855 |
| ISIN | US33739P8555 |
| Intraday NAV | FPEIIV |
| Fiscal Year-End | 10/31 |
| Exchange | NYSE Arca |
| Inception | 8/22/2017 |
| Inception Price | $20.00 |
| Inception NAV | $20.00 |
| Total Expense Ratio* | 0.85% |
* As of 3/2/2026
| Closing NAV1 | $19.26 |
| Closing Market Price2 | $19.28 |
| Bid/Ask Midpoint | $19.27 |
| Bid/Ask Premium | 0.05% |
| 30-Day Median Bid/Ask Spread (as of 5/13/2026)3 | 0.05% |
| Total Net Assets | $1,885,528,889 |
| Outstanding Shares | 97,900,002 |
| Daily Volume | 258,668 |
| Average 30-Day Daily Volume | 397,945 |
| Closing Market Price 52-Week High/Low | $19.60 / $18.51 |
| Closing NAV 52-Week High/Low | $19.57 / $18.56 |
| Number of Holdings (excluding cash) | 173 |
| Holding |
Percent |
| BANK OF AMERICA CORP Variable rate |
3.05% |
| CREDIT AGRICOLE SA Variable rate |
1.86% |
| ING GROEP NV Variable rate |
1.77% |
| TORONTO-DOMINION BANK Variable rate, due 10/31/2082 |
1.73% |
| BANCO BILBAO VIZCAYA ARGENTARIA Variable rate |
1.71% |
| CITIGROUP INC Series HH, Variable rate |
1.70% |
| ENBRIDGE INC Variable rate, due 01/15/2084 |
1.59% |
| BANCO SANTANDER SA Variable rate |
1.54% |
| CHARLES SCHWAB CORP Series H, Variable rate |
1.51% |
| BANK OF MONTREAL Variable rate, due 05/26/2084 |
1.46% |
* Excluding cash.
Holdings are subject to change.
| Country |
Percent |
| United States |
47.83% |
| Canada |
16.66% |
| France |
9.40% |
| United Kingdom |
8.54% |
| Spain |
5.65% |
| The Netherlands |
2.65% |
| Germany |
2.58% |
| Japan |
2.20% |
| Cayman Islands |
1.41% |
| Mexico |
0.86% |
Past performance is not indicative of future results.
 Among 65 funds in the Preferred Stock category. This fund was rated 5 stars/65 funds (3 years), 5 stars/57 funds (5 years) based on risk adjusted returns.
| Weighted Average Effective Duration9 | 4.42 Years |
| Weighted Average Yield-to-Worst10 | 6.27% |
| % Institutional Securities (e.g. $1000 par)11 | 98.29% |
| % Retail Securities (e.g. $25 par)12 | 1.71% |
| Weighted Average % of Par14 | 103.28% |
| CoCo/AT1 Exposure15 | 33.49% |
| Regional Bank Exposure16 | 1.52% |
| Security |
Percent |
| Fixed-to-Variable Rate Securities |
95.21% |
| Fixed Rate Securities |
3.60% |
| Floating Rate Securities |
1.19% |
| Credit Quality |
Percent |
| A |
0.52% |
| A- |
0.79% |
| BBB+ |
14.86% |
| BBB |
27.93% |
| BBB- |
36.90% |
| BB+ |
14.29% |
| BB |
3.61% |
| NR |
1.10% |
The credit quality and ratings information presented above reflect the ratings assigned by one or more nationally recognized statistical rating organizations (NRSROs), including S&P Global Ratings, Moody's Investors Service, Inc., Fitch Ratings, or a comparably rated NRSRO. For situations in which a security is rated by more than one NRSRO and the ratings are not equivalent, the highest rating is used. Sub-investment grade ratings are those rated BB+/Ba1 or lower. Investment grade ratings are those rated BBB-/Baa3 or higher. The credit ratings shown relate to the creditworthiness of the issuers of the underlying securities in the Fund, and not to the Fund or its shares. Credit ratings are subject to change.
|
|
2025 |
Q1 2026 |
Q2 2026 |
Q3 2026 |
| Days Traded at Premium |
220 |
52 |
11 |
--- |
| Days Traded at Discount |
30 |
9 |
20 |
--- |
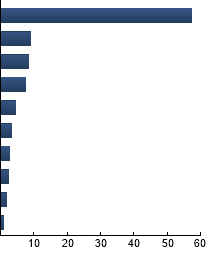
|
Banks
|
57.38%
|
|
Insurance
|
8.88%
|
|
Electric Utilities
|
8.38%
|
|
Capital Markets
|
7.41%
|
|
Multi-Utilities
|
4.54%
|
|
Diversified Telecommunication Services
|
3.27%
|
|
Oil, Gas & Consumable Fuels
|
2.67%
|
|
Financial Services
|
2.32%
|
|
Food Products
|
1.70%
|
|
Independent Power and Renewable Electricity Producers
|
1.03%
|
|
|
| |
Standard Deviation |
Alpha |
Beta |
Sharpe Ratio |
Correlation |
| FPEI |
4.81% |
-0.14 |
1.11 |
1.22 |
0.99 |
| Blended Benchmark |
4.30% |
--- |
1.00 |
1.26 |
1.00 |
Standard Deviation is a measure of price variability (risk). Alpha is an indication of how much an investment outperforms or underperforms
on a risk-adjusted basis relative to its benchmark.Beta is a measure of price variability relative to the market. Sharpe Ratio is a measure
of excess reward per unit of volatility. Correlation is a measure of the similarity of performance.
Blended Benchmark - The Blended Benchmark consists of a 45/40/15 blend of the ICE BofA US Investment Grade Institutional Capital Securities Index, the ICE USD Contingent Capital Index and the ICE BofA US High Yield Institutional Capital Securities Index. The Blended Benchmark is intended to reflect the proportional market cap of each segment within the institutional market. The Blended Benchmark returns are calculated by using the monthly returns of the three indices during each period shown above. At the beginning of each month the three indices are rebalanced to a 45/40/15 ratio to account for divergence from that ratio that occurred during the course of each month. The monthly returns are then compounded for each period shown above, giving the performance for the Blended Benchmark for each period shown above.
ICE USD Contingent Capital Index - The Index tracks the performance of investment grade and below investment grade contingent capital debt publicly issued in the major domestic and eurobond markets.
ICE BofA US High Yield Institutional Capital Securities Index - The Index tracks the performance of US dollar denominated sub-investment grade hybrid capital corporate and preferred securities publicly issued in the US domestic market. Bloomberg US Aggregate Bond Index - The Index covers the investment-grade, U.S. dollar-denominated, fixed-rate taxable bond market, including Treasuries, government-related and corporate securities, MBS, ABS, and CMBS. ICE BofA US Investment Grade Institutional Capital Securities Index - The Index tracks the performance of US dollar denominated investment grade hybrid capital corporate and preferred securities publicly issued in the US domestic market.
|
|
The information presented is not intended to constitute an investment recommendation for, or advice to, any specific person. By providing this information, First Trust is not undertaking to give advice in any fiduciary capacity within the meaning of ERISA, the Internal Revenue Code or any other regulatory framework. Financial professionals are responsible for evaluating investment risks independently and for exercising independent judgment in determining whether investments are appropriate for their clients.
|