|
|
 |
|
Investment Objective/Strategy - The First Trust Lunt U.S. Factor Rotation ETF (the "Fund"), seeks investment results that correspond generally to the price and yield (before the Fund's fees and expenses) of an equity index called the Lunt Capital Large Cap Factor Rotation Index (the "Index"). The Fund will normally invest at least 90% of its net assets (including investment borrowings) in common stocks that comprise the Index. The Fund, using an indexing investment approach, attempts to replicate, before fees and expenses, the performance of the Index.
There can be no assurance that the Fund's investment objectives will be achieved.
- The Lunt Capital Large Cap Factor Rotation Index is designed to provide exposure to U.S. large-cap equities, rotating among four select factors (momentum, value, volatility and quality) when they come into favor using the proprietary Lunt Factor Allocation Methodology.
- Index construction begins with a universe of eight factor-oriented sub-indices, representing the highest and lowest ranking stocks in each of the four factors.
- Each sub-index is comprised of 50 securities selected from the Nasdaq US 500 Large Cap™ Index.
- Using the Lunt Factor Allocation proprietary methodology, the eight sub-indices are ranked to determine which side of each factor (high or low) is exhibiting stronger risk-adjusted relative strength.
- Each of the sub-indices is given a score and the top four scoring sub-indices are selected for inclusion in the index.
- A high and a low sub-index from the same factor cannot be selected during the same monthly period.
- Each sub-index selected will hold a 25% weight in the index at the time of inclusion. If a selected sub-index is currently in the index, its weight remains unchanged. Newly selected sub-index(es) inherit the weighting of the outgoing sub-index(es). If all four sub-indexes change, each will receive a 25% weight.
- The eight sub-indices are evaluated monthly. The momentum, value and volatility sub-indices are rebalanced semi-annually and the quality sub-indices are rebalanced annually.
| Ticker | FCTR |
| Fund Type | Large Cap Core |
| Investment Advisor | First Trust Advisors L.P. |
| Investor Servicing Agent | Bank of New York Mellon Corp |
| CUSIP | 33733E872 |
| ISIN | US33733E8729 |
| Intraday NAV | FCTRIV |
| Fiscal Year-End | 12/31 |
| Exchange | Cboe BZX |
| Inception | 7/25/2018 |
| Inception Price | $20.23 |
| Inception NAV | $20.23 |
| Rebalance Frequency | Monthly |
| Total Expense Ratio* | 0.65% |
* As of 5/1/2026
| Closing NAV1 | $38.60 |
| Closing Market Price2 | $38.55 |
| Bid/Ask Midpoint | $38.59 |
| Bid/Ask Discount | 0.03% |
| 30-Day Median Bid/Ask Spread3 | 0.17% |
| Total Net Assets | $54,041,527 |
| Outstanding Shares | 1,400,002 |
| Daily Volume | 2,881 |
| Average 30-Day Daily Volume | 2,070 |
| Closing Market Price 52-Week High/Low | $41.32 / $32.50 |
| Closing NAV 52-Week High/Low | $41.33 / $32.48 |
| Number of Holdings (excluding cash) | 162 |
| Holding |
Percent |
| Western Digital Corporation |
3.19% |
| Bloom Energy Corporation (Class A) |
3.00% |
| Micron Technology, Inc. |
2.92% |
| Centene Corporation |
2.43% |
| Seagate Technology Holdings Plc |
2.41% |
| Ciena Corporation |
1.73% |
| Axon Enterprise Inc. |
1.47% |
| Teradyne, Inc. |
1.35% |
| Credo Technology Group Holding Ltd |
1.30% |
| Humana Inc. |
1.26% |
* Excluding cash.
Holdings are subject to change.
Past performance is not indicative of future results.
| Maximum Market Cap. | $1,579,657 |
| Median Market Cap. | $42,612 |
| Minimum Market Cap. | $9,340 |
| Price/Earnings | 21.48 |
| Price/Book | 2.70 |
| Price/Cash Flow | 14.36 |
| Price/Sales | 1.13 |
| High Momentum | 23.95% |
| High Value | 24.15% |
| High Volatility | 28.40% |
| Low Quality | 23.50% |
|
|
2025 |
Q1 2026 |
Q2 2026 |
Q3 2026 |
| Days Traded at Premium |
184 |
12 |
25 |
2 |
| Days Traded at Discount |
66 |
49 |
37 |
15 |
|
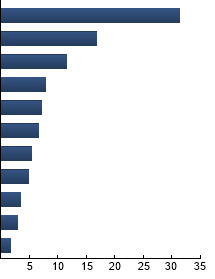
Information Technology
|
31.31%
|
|
Industrials
|
16.85%
|
|
Financials
|
11.62%
|
|
Health Care
|
7.89%
|
|
Materials
|
7.09%
|
|
Consumer Discretionary
|
6.60%
|
|
Energy
|
5.41%
|
|
Consumer Staples
|
4.97%
|
|
Communication Services
|
3.47%
|
|
Utilities
|
2.99%
|
|
Real Estate
|
1.80%
|
|
|
Tracking Index: Lunt Capital Large Cap Factor Rotation Index
| |
Standard Deviation |
Alpha |
Beta |
Sharpe Ratio |
Correlation |
| FCTR |
16.53% |
-3.77 |
1.04 |
0.74 |
0.84 |
| Nasdaq US 500 Large Cap™ Index |
13.36% |
--- |
1.00 |
1.14 |
1.00 |
Standard Deviation is a measure of price variability (risk). Alpha is an indication of how much an investment outperforms or underperforms
on a risk-adjusted basis relative to its benchmark.Beta is a measure of price variability relative to the market. Sharpe Ratio is a measure
of excess reward per unit of volatility. Correlation is a measure of the similarity of performance.
Nasdaq US 500 Large Cap™ Index - The Index is a float modified market capitalization weighted index that contains the top 500 securities from the NASDAQ US Benchmark™ Index. S&P 500® Index - The Index is an unmanaged index of 500 companies used to measure large-cap U.S. stock market performance.
|
|
The information presented is not intended to constitute an investment recommendation for, or advice to, any specific person. By providing this information, First Trust is not undertaking to give advice in any fiduciary capacity within the meaning of ERISA, the Internal Revenue Code or any other regulatory framework. Financial professionals are responsible for evaluating investment risks independently and for exercising independent judgment in determining whether investments are appropriate for their clients.
|