|
|
 |
|
Investment Objective/Strategy - The First Trust Indxx Global Natural Resources Income ETF is an exchange-trade fund. The investment objective of the Fund is to seek investment results that correspond generally to the price and yield, before the Fund's fees and expenses, of an equity index called the Indxx Global Natural Resources Income Index.
There can be no assurance that the Fund's investment objectives will be achieved.
-
The Indxx Global Natural Resources Income Index is a free float adjusted market capitalization weighted index designed to
measure the market performance of the highest dividend yielding companies involved in the upstream segment of the natural
resources sector.
-
Each security in the index must meet certain eligibility criteria based on liquidity, size and dividend history.
-
Companies may generally be domiciled in any country, including emerging markets, subject to certain exclusions determined by
the Index Provider based on certain criteria.
-
Securities are classified into the following broad five categories:
- Energy, Materials, Agriculture, Water and Timber.
-
Top 50 companies by dividend yield form the interim portfolio.
-
The number of securities in each of the above-defined categories is capped at 30%.
-
The Index is reconstituted annually in June and is rebalanced quarterly in June, September, December and March.
| Ticker | FTRI |
| Fund Type | Natural Resources |
| Investment Advisor | First Trust Advisors L.P. |
| Investor Servicing Agent | Bank of New York Mellon Corp |
| CUSIP | 33734X838 |
| ISIN | US33734X8386 |
| Intraday NAV | FTRIIV |
| Fiscal Year-End | 09/30 |
| Exchange | Nasdaq |
| Inception | 3/11/2010 |
| Inception Price | $30.00 |
| Inception NAV | $30.00 |
| Rebalance Frequency | Quarterly |
| Total Expense Ratio* | 0.70% |
* As of 2/2/2026
| Closing NAV1 | $16.18 |
| Closing Market Price2 | $16.18 |
| Bid/Ask Midpoint | $16.17 |
| Bid/Ask Discount | 0.09% |
| 30-Day Median Bid/Ask Spread3 | 0.13% |
| Total Net Assets | $120,516,091 |
| Outstanding Shares | 7,450,002 |
| Daily Volume | 6,329 |
| Average 30-Day Daily Volume | 50,272 |
| Closing Market Price 52-Week High/Low | $19.11 / $14.12 |
| Closing NAV 52-Week High/Low | $19.12 / $14.11 |
| Number of Holdings (excluding cash) | 51 |
| Holding |
Percent |
| TotalEnergies SE |
9.21% |
| Barrick Mining Corporation |
9.01% |
| E.ON SE |
7.61% |
| AngloGold Ashanti plc |
6.03% |
| Nutrien Ltd. |
5.04% |
| Veolia Environnement S.A. |
4.92% |
| Gold Fields Limited (ADR) |
4.14% |
| American Water Works Company, Inc. |
4.13% |
| AXIA Energia (ADR) |
3.59% |
| Zijin Mining Group Company Limited (Class H) |
3.40% |
* Excluding cash.
Holdings are subject to change.
Past performance is not indicative of future results.
| Maximum Market Cap. | $172,625 |
| Median Market Cap. | $12,271 |
| Minimum Market Cap. | $1,087 |
| Price/Earnings | 13.96 |
| Price/Book | 1.86 |
| Price/Cash Flow | 7.60 |
| Price/Sales | 1.19 |
| Country |
Percent |
| United States |
17.77% |
| Canada |
17.65% |
| France |
14.16% |
| United Kingdom |
11.45% |
| Germany |
7.63% |
| South Africa |
5.61% |
| China |
4.59% |
| Brazil |
3.60% |
| Switzerland |
3.01% |
| Australia |
2.66% |
|
|
2025 |
Q1 2026 |
Q2 2026 |
Q3 2026 |
| Days Traded at Premium |
107 |
42 |
31 |
0 |
| Days Traded at Discount |
143 |
19 |
31 |
12 |
|
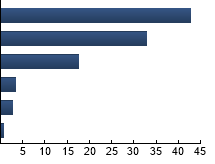
Materials
|
42.83%
|
|
Utilities
|
32.74%
|
|
Energy
|
17.58%
|
|
Consumer Staples
|
3.33%
|
|
Real Estate
|
2.77%
|
|
Industrials
|
0.75%
|
|
|
Tracking Index: Indxx Global Natural Resources Income Index
| |
Standard Deviation |
Alpha |
Beta |
Sharpe Ratio |
Correlation |
| FTRI |
16.06% |
0.81 |
0.51 |
0.50 |
0.40 |
| MSCI ACWI Materials Index |
17.97% |
-6.02 |
0.98 |
0.45 |
0.69 |
| MSCI ACWI Index |
12.65% |
--- |
1.00 |
1.13 |
1.00 |
Standard Deviation is a measure of price variability (risk). Alpha is an indication of how much an investment outperforms or underperforms
on a risk-adjusted basis relative to its benchmark.Beta is a measure of price variability relative to the market. Sharpe Ratio is a measure
of excess reward per unit of volatility. Correlation is a measure of the similarity of performance.
MSCI ACWI Materials Index - The Index is a free float-adjusted market capitalization-weighted index that is designed to measure the materials sector performance of developed and emerging markets. MSCI ACWI Index - The Index is a free float-adjusted market capitalization-weighted index that is designed to measure the equity market performance of developed and emerging markets.
|
|
The information presented is not intended to constitute an investment recommendation for, or advice to, any specific person. By providing this information, First Trust is not undertaking to give advice in any fiduciary capacity within the meaning of ERISA, the Internal Revenue Code or any other regulatory framework. Financial professionals are responsible for evaluating investment risks independently and for exercising independent judgment in determining whether investments are appropriate for their clients.
|