|
|
 |
|
Investment Objective/Strategy - The First Trust SSI Strategic Convertible Securities ETF is an actively managed exchange-traded fund that seeks to deliver total return by investing, under normal market conditions, at least 80% of its net assets in a diversified portfolio of U.S. and non-U.S. convertible securities.
There can be no assurance that the Fund's investment objectives will be achieved.
| Ticker | FCVT |
| Fund Type | Convertible Securities |
| Investment Advisor | First Trust Advisors L.P. |
| Investor Servicing Agent | Bank of New York Mellon Corp |
| Portfolio Manager/Sub-Advisor | SSI Investment Management LLC |
| CUSIP | 33739Q507 |
| ISIN | US33739Q5071 |
| Intraday NAV | FCVTIV |
| Fiscal Year-End | 10/31 |
| Exchange | Nasdaq |
| Inception | 11/3/2015 |
| Inception Price | $25.00 |
| Inception NAV | $25.00 |
| Total Expense Ratio* | 0.95% |
* As of 3/2/2026
| Closing NAV1 | $49.19 |
| Closing Market Price2 | $49.08 |
| Bid/Ask Midpoint | $49.07 |
| Bid/Ask Discount | 0.25% |
| 30-Day Median Bid/Ask Spread3 | 0.47% |
| Total Net Assets | $100,830,531 |
| Outstanding Shares | 2,050,002 |
| Daily Volume | 28,813 |
| Average 30-Day Daily Volume | 35,985 |
| Closing Market Price 52-Week High/Low | $54.68 / $39.41 |
| Closing NAV 52-Week High/Low | $54.54 / $39.47 |
| Number of Holdings (excluding cash) | 123 |
| Holding |
Percent |
| NEBIUS GROUP NV Convertible, 1.25%, due 03/15/2031 |
3.27% |
| Alphabet Inc., Series A, Convertible, 6.25%, Due 05/15/2029 |
3.26% |
| Western Digital Corporation |
3.17% |
| Alphabet Inc., Series B, Convertible, 6.25%, Due 05/15/2029 |
2.89% |
| MORGAN STANLEY FIN LLC Convertible, 0.125%, due 04/26/2030 |
2.22% |
| The Boeing Company, Convertible, 6.00%, Due 10/15/2027 |
2.21% |
| LIVE NATION ENTERTAINMENT Convertible, 2.875%, due 01/15/2030 |
2.15% |
| NEXTERA ENERGY CAPITAL Convertible, 3%, due 03/01/2027 |
1.87% |
| AKAMAI TECHNOLOGIES INC Convertible, 0.25%, due 05/15/2033 |
1.75% |
| Wells Fargo & Company, Series L, 7.500% |
1.74% |
* Excluding cash.
Holdings are subject to change.
Past performance is not indicative of future results.
| Weighted Average Effective Duration4 | 0.90 Years |
|
Percent |
| Convertible Bond |
76.99% |
| Mandatory Preferred |
17.02% |
| Common Stock |
3.11% |
| Convertible Preferred |
2.36% |
| Cash & Equivalent |
0.52% |
|
|
2025 |
Q1 2026 |
Q2 2026 |
Q3 2026 |
| Days Traded at Premium |
56 |
12 |
8 |
2 |
| Days Traded at Discount |
194 |
49 |
54 |
20 |
|
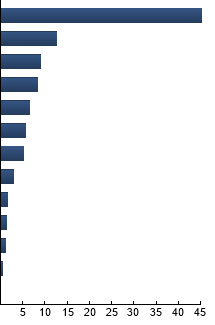
Technology
|
45.20%
|
|
Health Care
|
12.69%
|
|
Industrials
|
8.94%
|
|
Financials
|
8.43%
|
|
Utilities
|
6.47%
|
|
Media
|
5.73%
|
|
Consumer Discretionary
|
5.08%
|
|
Telecommunications
|
2.96%
|
|
Materials
|
1.58%
|
|
Transportation
|
1.29%
|
|
Energy
|
1.11%
|
|
Cash & Accrued Income
|
0.52%
|
|
Consumer Staples
|
0.00%
|
|
|
Please note that percentage of 0.00 indicates an amount less than 0.01%.
| |
Standard Deviation |
Alpha |
Beta |
Sharpe Ratio |
Correlation |
| FCVT |
13.90% |
-0.61 |
1.19 |
1.06 |
0.99 |
| ICE BofA US Convertible Index |
11.54% |
--- |
1.00 |
1.12 |
1.00 |
Standard Deviation is a measure of price variability (risk). Alpha is an indication of how much an investment outperforms or underperforms
on a risk-adjusted basis relative to its benchmark.Beta is a measure of price variability relative to the market. Sharpe Ratio is a measure
of excess reward per unit of volatility. Correlation is a measure of the similarity of performance.
Bloomberg US Aggregate Bond Index - The Index covers the investment-grade, U.S. dollar-denominated, fixed-rate taxable bond market, including Treasuries, government-related and corporate securities, MBS, ABS, and CMBS. ICE BofA US Convertible Index - The Index measures the return of all U.S. convertibles.
|
|
The information presented is not intended to constitute an investment recommendation for, or advice to, any specific person. By providing this information, First Trust is not undertaking to give advice in any fiduciary capacity within the meaning of ERISA, the Internal Revenue Code or any other regulatory framework. Financial professionals are responsible for evaluating investment risks independently and for exercising independent judgment in determining whether investments are appropriate for their clients.
|