|
|
 |
|
Investment Objective/Strategy - The First Trust NASDAQ® Clean Edge® Green Energy Index Fund is an exchange-traded index fund. The objective of the Fund is to seek investment results that correspond generally to the price and yield (before the Fund's fees and expenses) of an equity index called the Nasdaq® Clean Edge® Green Energy™ Index.
There can be no assurance that the Fund's investment objectives will be achieved.
- The index begins with a universe of common stocks and depositary receipts of small, mid and large cap companies listed on a U.S. securities exchange.
- To be eligible for the index, a security must be issued by companies classified as technology manufacturers, developers, distributors, and/or installers in one of the following sub-sectors:
- Advanced Materials – Nanotech, membranes, silicon, lithium, carbon capture and utilization and other materials and processes that enable clean-energy technologies.
- Energy Intelligence – Conservation, automated meter reading, energy management systems, smart grid, superconductors and power controls.
- Renewable Electricity Generation & Renewable Fuels – Solar photovoltaics, concentrating solar, wind, geothermal, and ethanol, biodiesel, biofuel enabling enzymes.
- Energy Storage & Conversion – Advanced batteries, hybrid drivetrains, hydrogen, fuel cells for stationary, portable and transportation applications.
- The security’s issuer must not be identified by the U.S. Securities and Exchange Commission as having used to audit its financial statements an accounting firm that has been identified by the Public Company Accounting Oversight Board (PCAOB) under the Holding Foreign Companies Accountable Act (HFCAA).
- Eligible securities must:
- Be issued by a company with a market capitalization of at least $150 million;
- Have a minimum average daily trading volume of at least 100,000 shares;
- Have a minimum closing price per share of $1.
- Securities selected for inclusion in the index are weighted according to modified market capitalization methodology.
- The index is rebalanced quarterly and reconstituted semi-annually.
| Ticker | QCLN |
| Fund Type | Alternative Energy |
| Investment Advisor | First Trust Advisors L.P. |
| Investor Servicing Agent | Bank of New York Mellon Corp |
| CUSIP | 33733E500 |
| ISIN | US33733E5006 |
| Intraday NAV | QCLNIV |
| Fiscal Year-End | 12/31 |
| Exchange | Nasdaq |
| Inception | 2/8/2007 |
| Inception Price | $20.00 |
| Inception NAV | $20.00 |
| Rebalance Frequency | Quarterly |
| Total Expense Ratio* | 0.59% |
| Net Expense Ratio* | 0.59% |
* As of 5/1/2026
Expenses are capped contractually at 0.60% per year, at least through April 30, 2027.
| Closing NAV1 | $52.85 |
| Closing Market Price2 | $52.82 |
| Bid/Ask Midpoint | $52.85 |
| Bid/Ask Discount | 0.01% |
| 30-Day Median Bid/Ask Spread3 | 0.11% |
| Total Net Assets | $647,353,106 |
| Outstanding Shares | 12,250,002 |
| Daily Volume | 158,408 |
| Average 30-Day Daily Volume | 230,256 |
| Closing Market Price 52-Week High/Low | $68.47 / $34.31 |
| Closing NAV 52-Week High/Low | $68.43 / $34.33 |
| Number of Holdings (excluding cash) | 52 |
| Holding |
Percent |
| Monolithic Power Systems, Inc. |
8.95% |
| Tesla, Inc. |
8.60% |
| Bloom Energy Corporation (Class A) |
7.67% |
| ON Semiconductor Corporation |
7.67% |
| First Solar, Inc. |
6.82% |
| Rivian Automotive, Inc. (Class A) |
6.02% |
| Advanced Energy Industries, Inc. |
4.12% |
| Acuity Inc. |
3.43% |
| Nextpower Inc. (Class A) |
3.36% |
| Albemarle Corporation |
3.33% |
* Excluding cash.
Holdings are subject to change.
Past performance is not indicative of future results.
| Maximum Market Cap. | $1,579,657 |
| Median Market Cap. | $3,373 |
| Minimum Market Cap. | $222 |
| Price/Earnings | 44.18 |
| Price/Book | 4.74 |
| Price/Cash Flow | 24.23 |
| Price/Sales | 5.09 |
|
|
2025 |
Q1 2026 |
Q2 2026 |
Q3 2026 |
| Days Traded at Premium |
58 |
30 |
34 |
7 |
| Days Traded at Discount |
192 |
31 |
28 |
8 |
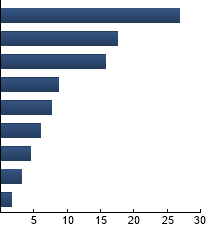
|
Semiconductors
|
26.81%
|
|
Renewable Energy Equipment
|
17.59%
|
|
Automobiles
|
15.78%
|
|
Alternative Electricity
|
8.72%
|
|
Machinery: Specialty
|
7.68%
|
|
Electrical Components
|
6.02%
|
|
Chemicals: Diversified
|
4.51%
|
|
General Mining
|
3.16%
|
|
Real Estate Holding and Development
|
1.66%
|
|
|
Tracking Index: Nasdaq® Clean Edge® Green Energy™ Index
| |
Standard Deviation |
Alpha |
Beta |
Sharpe Ratio |
Correlation |
| QCLN |
35.42% |
-12.85 |
1.43 |
0.23 |
0.81 |
| Russell 2000® Index |
19.99% |
--- |
1.00 |
0.73 |
1.00 |
Standard Deviation is a measure of price variability (risk). Alpha is an indication of how much an investment outperforms or underperforms
on a risk-adjusted basis relative to its benchmark.Beta is a measure of price variability relative to the market. Sharpe Ratio is a measure
of excess reward per unit of volatility. Correlation is a measure of the similarity of performance.
Russell 2000® Index - The Index is comprised of the smallest 2000 companies in the Russell 3000 Index. Russell 3000® Index - The Index is comprised of the 3000 largest and most liquid stocks based and traded in the U.S.
|
|
The information presented is not intended to constitute an investment recommendation for, or advice to, any specific person. By providing this information, First Trust is not undertaking to give advice in any fiduciary capacity within the meaning of ERISA, the Internal Revenue Code or any other regulatory framework. Financial professionals are responsible for evaluating investment risks independently and for exercising independent judgment in determining whether investments are appropriate for their clients.
|