|
|
 |
|
Investment Objective/Strategy - The First Trust US Equity Opportunities ETF (the "Fund"), formerly First Trust US IPO Index Fund, seeks investment results that correspond generally to the price and yield (before the Fund's fees and expenses) of an equity index called the IPOX®-100 U.S. Index. The Fund will normally invest at least 90% of its net assets (including investment borrowings) in the common stocks that comprise the Index.
There can be no assurance that the Fund's investment objectives will be achieved.
- The IPOX®-100 U.S. Index seeks exposure to 100 of the largest, most liquid and best performing U.S. companies that have recently gone public, including initial public offerings (“IPOs”) and spin-offs, as well as select acquirers of recent IPOs.
- The index is based on the IPOX® U.S. Composite Index, which is a market-cap weighted index measuring the performance of all newly public U.S. listed companies during their first 1,000 trading days, subject to meeting initial listings characteristics.
- The index applies a 10% capping to all constituents and is reconstituted and rebalanced on a quarterly basis.
Potential Benefits of the First Trust US Equity Opportunities ETF
- Systematic exposure to U.S. equity capital markets and the growth and innovativeness of the U.S. economy via a semi-passive indexing approach.
- Based on a proven, disciplined and transparent index methodology. The IPOX®-100 U.S. Index has historically captured around 85% of all total market capitalization created through U.S. IPO and spin-off activity during the past four years. Core position in large-cap stocks with tilt towards mid- and small-cap stocks.
- Innovative investment tool for various market participants, including buy-and-hold investors seeking timely and systematic exposure to newly listed companies as well as active market participants due to dynamic index properties and limited overlap with benchmarks.
- High correlation to private markets returns, including private equity, venture capital and pre-IPO.
| Ticker | FPX |
| Fund Type | Growth |
| Investment Advisor | First Trust Advisors L.P. |
| Investor Servicing Agent | Bank of New York Mellon Corp |
| CUSIP | 336920103 |
| ISIN | US3369201039 |
| Intraday NAV | FPXIV |
| Fiscal Year-End | 12/31 |
| Exchange | NYSE Arca |
| Inception | 4/12/2006 |
| Inception Price | $20.00 |
| Inception NAV | $20.00 |
| Rebalance Frequency | Quarterly |
| Total Expense Ratio* | 0.57% |
| Net Expense Ratio* | 0.57% |
* As of 5/1/2026
Expenses are capped contractually at 0.60% per year, at least through April 30, 2027.
| Closing NAV1 | $177.59 |
| Closing Market Price2 | $177.43 |
| Bid/Ask Midpoint | $177.63 |
| Bid/Ask Premium | 0.02% |
| 30-Day Median Bid/Ask Spread3 | 0.09% |
| Total Net Assets | $1,465,107,908 |
| Outstanding Shares | 8,250,002 |
| Daily Volume | 42,261 |
| Average 30-Day Daily Volume | 57,132 |
| Closing Market Price 52-Week High/Low | $206.18 / $146.79 |
| Closing NAV 52-Week High/Low | $206.19 / $146.91 |
| Number of Holdings (excluding cash) | 100 |
| Holding |
Percent |
| GE Vernova Inc. |
10.93% |
| Seagate Technology Holdings Plc |
6.45% |
| Sandisk Corporation |
6.43% |
| Eli Lilly and Company |
3.63% |
| Warner Bros. Discovery, Inc. |
2.95% |
| Medline Inc. (Class A) |
2.89% |
| Lumentum Holdings Inc. |
2.49% |
| Applovin Corp. (Class A) |
2.09% |
| UL Solutions Inc. (Class A) |
2.07% |
| FedEx Corporation |
2.03% |
* Excluding cash.
Holdings are subject to change.
Past performance is not indicative of future results.
 Among 459 funds in the Mid-Cap Growth category. This fund was rated 5 stars/459 funds (3 years), 4 stars/441 funds (5 years), 4 stars/377 funds (10 years) based on risk adjusted returns.
| Maximum Market Cap. | $2,249,091 |
| Median Market Cap. | $12,370 |
| Minimum Market Cap. | $508 |
| Price/Earnings | 37.98 |
| Price/Book | 5.59 |
| Price/Cash Flow | 25.45 |
| Price/Sales | 2.58 |
|
|
2025 |
Q1 2026 |
Q2 2026 |
Q3 2026 |
| Days Traded at Premium |
122 |
18 |
34 |
15 |
| Days Traded at Discount |
128 |
43 |
28 |
7 |
|
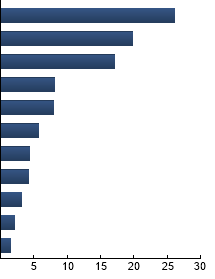
Information Technology
|
26.09%
|
|
Industrials
|
19.86%
|
|
Health Care
|
17.04%
|
|
Financials
|
8.10%
|
|
Communication Services
|
7.94%
|
|
Consumer Discretionary
|
5.70%
|
|
Energy
|
4.31%
|
|
Consumer Staples
|
4.15%
|
|
Real Estate
|
3.18%
|
|
Materials
|
2.10%
|
|
Utilities
|
1.53%
|
|
|
Tracking Index: IPOX® 100 U.S. Index
| |
Standard Deviation |
Alpha |
Beta |
Sharpe Ratio |
Correlation |
| FPX |
24.11% |
4.00 |
1.54 |
1.12 |
0.85 |
| Russell 3000® Index |
13.39% |
--- |
1.00 |
1.12 |
1.00 |
Standard Deviation is a measure of price variability (risk). Alpha is an indication of how much an investment outperforms or underperforms
on a risk-adjusted basis relative to its benchmark.Beta is a measure of price variability relative to the market. Sharpe Ratio is a measure
of excess reward per unit of volatility. Correlation is a measure of the similarity of performance.
Russell 3000® Index - The Index is comprised of the 3000 largest and most liquid stocks based and traded in the U.S. S&P 500® Index - The Index is an unmanaged index of 500 companies used to measure large-cap U.S. stock market performance.
|
|
The information presented is not intended to constitute an investment recommendation for, or advice to, any specific person. By providing this information, First Trust is not undertaking to give advice in any fiduciary capacity within the meaning of ERISA, the Internal Revenue Code or any other regulatory framework. Financial professionals are responsible for evaluating investment risks independently and for exercising independent judgment in determining whether investments are appropriate for their clients.
|