|
|
 |
|
Investment Objective/Strategy - The First Trust S&P International Dividend Aristocrats ETF (the "Fund"), formerly the International Multi-Asset Diversified Income Index Fund, seeks investment results that correspond generally to the price and yield (before the Fund's fees and expenses) of an index called the S&P International Dividend Aristocrats Index (the "Index"). Under normal conditions, the Fund will invest at least 90% of its net assets (including investment borrowings) in the equity securities that comprise the Index. The Fund, using an indexing investment approach, attempts to replicate, before fees and expenses, the performance of the Index. The Fund's investment advisor seeks a correlation of 0.95 or better (before fees and expenses) between the Fund's performance and the performance of the Index; a figure of 1.00 would represent perfect correlation.
There can be no assurance that the Fund's investment objectives will be achieved.
- The index begins with the S&P Global Broad Market Index and eliminates those companies that do not have an average daily traded value of at least $5 million for the 3-months prior to the rebalancing reference date.
- Every security must have a float-adjusted market capitalization of at least $1 billion and must meet stringent eligibility criteria.
- Historical dividend increases, dividend yield and payout ratio are examined.
- The 100 eligible securities with the highest indicated dividend yield are considered, subject to a maximum of 20 securities from any one country and a maximum of 35 securities from any one Global Industry Classification Standard (GICS) sector.
- U.S. stocks are excluded from inclusion and approximately 80 - 100 eligible securities are selected.
- Index constituents are weighted by indicated annual dividend yield. At each rebalancing, the weight for each index constituent is capped at 3%, and the weight of each country and GICS sector is capped at 25%, respectively.
- The index is rebalanced annually.
| Ticker | FID |
| Fund Type | Foreign Equity Income |
| Investment Advisor | First Trust Advisors L.P. |
| Investor Servicing Agent | Bank of New York Mellon Corp |
| CUSIP | 33738R688 |
| ISIN | US33738R6889 |
| Intraday NAV | FIDIV |
| Fiscal Year-End | 09/30 |
| Exchange | Nasdaq |
| Inception | 8/22/2013 |
| Inception Price | $19.97 |
| Inception NAV | $19.97 |
| Rebalance Frequency | Annual |
| Total Expense Ratio* | 0.60% |
* As of 2/2/2026
| Closing NAV1 | $21.39 |
| Closing Market Price2 | $21.50 |
| Bid/Ask Midpoint | $21.89 |
| Bid/Ask Premium | 2.34% |
| 30-Day Median Bid/Ask Spread3 | 0.49% |
| Total Net Assets | $157,197,644 |
| Outstanding Shares | 7,350,002 |
| Daily Volume | 7,758 |
| Average 30-Day Daily Volume | 13,639 |
| Closing Market Price 52-Week High/Low | $22.53 / $19.17 |
| Closing NAV 52-Week High/Low | $22.44 / $19.10 |
| Number of Holdings (excluding cash) | 73 |
| Holding |
Percent |
| Lenovo Group Limited |
3.13% |
| Legal & General Group Plc |
2.44% |
| APA Group |
2.17% |
| TELUS Corporation |
2.11% |
| Schroders Plc |
1.85% |
| Vanguard International Semiconductor Corporation |
1.84% |
| Pembina Pipeline Corporation |
1.80% |
| Keyera Corp. |
1.76% |
| DNB Bank ASA |
1.73% |
| LondonMetric Property Plc |
1.71% |
* Excluding cash.
Holdings are subject to change.
Past performance is not indicative of future results.
| Maximum Market Cap. | $261,422 |
| Median Market Cap. | $13,655 |
| Minimum Market Cap. | $1,775 |
| Price/Earnings | 15.66 |
| Price/Book | 1.55 |
| Price/Cash Flow | 8.58 |
| Price/Sales | 1.29 |
| Country |
Percent |
| Canada |
18.00% |
| Switzerland |
11.30% |
| United Kingdom |
11.10% |
| Japan |
10.35% |
| Hong Kong |
8.12% |
| China |
6.66% |
| Italy |
5.40% |
| South Korea |
4.75% |
| France |
4.19% |
| Taiwan |
3.00% |
|
|
2025 |
Q1 2026 |
Q2 2026 |
Q3 2026 |
| Days Traded at Premium |
236 |
52 |
50 |
--- |
| Days Traded at Discount |
14 |
9 |
10 |
--- |
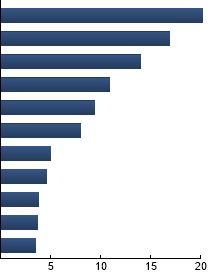
|
Financials
|
20.15%
|
|
Utilities
|
16.89%
|
|
Industrials
|
14.05%
|
|
Communication Services
|
10.86%
|
|
Real Estate
|
9.45%
|
|
Energy
|
8.00%
|
|
Information Technology
|
4.99%
|
|
Materials
|
4.64%
|
|
Consumer Discretionary
|
3.83%
|
|
Consumer Staples
|
3.67%
|
|
Health Care
|
3.47%
|
|
|
Tracking Index: S&P International Dividend Aristocrats Index
| |
Standard Deviation |
Alpha |
Beta |
Sharpe Ratio |
Correlation |
| FID |
11.90% |
2.72 |
0.79 |
1.13 |
0.88 |
| Dow Jones EPAC Select Dividend™ Index |
12.64% |
8.88 |
0.85 |
1.61 |
0.89 |
| MSCI World ex USA Index |
13.37% |
--- |
1.00 |
1.02 |
1.00 |
Standard Deviation is a measure of price variability (risk). Alpha is an indication of how much an investment outperforms or underperforms
on a risk-adjusted basis relative to its benchmark.Beta is a measure of price variability relative to the market. Sharpe Ratio is a measure
of excess reward per unit of volatility. Correlation is a measure of the similarity of performance.
Dow Jones EPAC Select Dividend™ Index - The Index consists of high dividend paying companies in the EPAC (Europe, Pacific, Asia and Canada) region, which covers developed markets excluding the United States. MSCI World ex USA Index - The Index includes developed markets and is designed to provide a broad measure of stock performance throughout the world, with the exception of U.S.-based companies.
|
|
The information presented is not intended to constitute an investment recommendation for, or advice to, any specific person. By providing this information, First Trust is not undertaking to give advice in any fiduciary capacity within the meaning of ERISA, the Internal Revenue Code or any other regulatory framework. Financial professionals are responsible for evaluating investment risks independently and for exercising independent judgment in determining whether investments are appropriate for their clients.
|