|
|
 |
|
Investment Objective/Strategy - The First Trust Eurozone AlphaDEX® ETF is an exchange-traded fund. The investment objective of the Fund is to seek investment results that correspond generally to the price and yield, before the Fund's fees and expenses, of an index called the Nasdaq AlphaDEX® Eurozone™ Index.
There can be no assurance that the Fund's investment objectives will be achieved.
- The Index is an "enhanced" index created and administered by Nasdaq, Inc. ("Nasdaq") which employs the AlphaDEX® stock selection methodology to select stocks from the Nasdaq Eurozone™ Index that meet certain criteria.
- Nasdaq constructs the Index by ranking the eligible stocks from the Nasdaq Eurozone™ Index on growth factors including 3-, 6- and 12- month price appreciation, sales to price and one year sales growth, and separately on value factors including book value to price, cash flow to price and return on assets. All stocks are ranked on the sum of ranks for the growth factors and, separately, all stocks are ranked on the sum of ranks for the value factors. A stock must have data for all growth and/or value factors to receive a rank for that style.
- Each stock receives the best style rank from the previous step as its selection score.
- The top 150 stocks based on the selection score determined in the previous step comprise the "selected stocks". The selected stocks are divided into quintiles based on their rankings and the top ranked quintiles receive a higher weight within the index. The stocks are equally-weighted within each quintile.
- Each stock is then tested in order of its selection score rank to check if the weight assigned to that stock is outside the country/sector weighting constraints, which are set at 15% above the benchmark weight.
- If the weight assigned to the stock, when added with the weight assigned to all higher ranking stocks in its country/sector, is greater than the constraint, then the stock's weight is lowered to the highest rank in the next quintile. Stocks previously lower in rank then move up one rank. Such stocks in the lowest quintile that violate a constraint are removed from the portfolio and replaced by the highest scoring stock not originally selected, subject to country/sector constraints. This process continues until all the country/sector weightings meet the constraint.
- The Index is reconstituted and rebalanced semi-annually.
| Ticker | FEUZ |
| Fund Type | International Equity |
| Investment Advisor | First Trust Advisors L.P. |
| Investor Servicing Agent | Bank of New York Mellon Corp |
| CUSIP | 33737J505 |
| ISIN | US33737J5056 |
| Intraday NAV | FEUZIV |
| Fiscal Year-End | 12/31 |
| Exchange | Nasdaq |
| Inception | 10/21/2014 |
| Inception Price | $30.55 |
| Inception NAV | $30.55 |
| Rebalance Frequency | Semi-Annual |
| Total Expense Ratio* | 0.80% |
* As of 5/1/2026
| Closing NAV1 | $66.33 |
| Closing Market Price2 | $65.94 |
| Bid/Ask Midpoint | $65.88 |
| Bid/Ask Discount | 0.69% |
| 30-Day Median Bid/Ask Spread (as of 7/17/2026)3 | 0.63% |
| Total Net Assets | $132,654,007 |
| Outstanding Shares | 2,000,002 |
| Daily Volume | 48,754 |
| Average 30-Day Daily Volume | 4,171 |
| Closing Market Price 52-Week High/Low | $69.28 / $55.02 |
| Closing NAV 52-Week High/Low | $69.43 / $54.85 |
| Number of Holdings (excluding cash) | 150 |
| Holding |
Percent |
| Glanbia Plc |
1.38% |
| ArcelorMittal |
1.36% |
| thyssenkrupp AG |
1.33% |
| Prysmian SpA |
1.30% |
| Motor Oil (Hellas) Corinth Refineries S.A. |
1.29% |
| Deutsche Lufthansa AG |
1.26% |
| Hochtief AG |
1.22% |
| Randstad N.V. |
1.21% |
| Klepierre |
1.20% |
| Aurubis AG |
1.17% |
* Excluding cash.
Holdings are subject to change.
Past performance is not indicative of future results.
| Maximum Market Cap. | $756,770 |
| Median Market Cap. | $13,869 |
| Minimum Market Cap. | $3,381 |
| Price/Earnings | 13.85 |
| Price/Book | 1.40 |
| Price/Cash Flow | 7.67 |
| Price/Sales | 0.75 |
| Country |
Percent |
| Germany |
21.52% |
| France |
20.44% |
| Italy |
14.52% |
| The Netherlands |
9.35% |
| Spain |
9.06% |
| Belgium |
4.98% |
| Finland |
4.42% |
| Greece |
4.33% |
| Austria |
4.30% |
| Ireland |
2.28% |
|
|
2025 |
Q1 2026 |
Q2 2026 |
Q3 2026 |
| Days Traded at Premium |
185 |
46 |
18 |
3 |
| Days Traded at Discount |
65 |
15 |
44 |
10 |
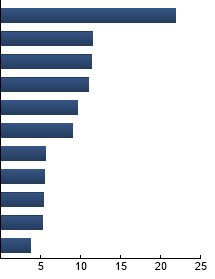
|
Industrials
|
21.86%
|
|
Financials
|
11.52%
|
|
Materials
|
11.38%
|
|
Energy
|
11.02%
|
|
Utilities
|
9.68%
|
|
Consumer Discretionary
|
8.96%
|
|
Real Estate
|
5.57%
|
|
Consumer Staples
|
5.56%
|
|
Health Care
|
5.36%
|
|
Information Technology
|
5.30%
|
|
Communication Services
|
3.79%
|
|
|
Tracking Index: Nasdaq AlphaDEX® Eurozone™ Index
| |
Standard Deviation |
Alpha |
Beta |
Sharpe Ratio |
Correlation |
| FEUZ |
15.36% |
4.28 |
0.93 |
1.08 |
0.93 |
| MSCI EMU Index |
15.13% |
0.18 |
0.99 |
0.88 |
1.00 |
| Nasdaq Eurozone™ Index |
15.24% |
--- |
1.00 |
0.87 |
1.00 |
Standard Deviation is a measure of price variability (risk). Alpha is an indication of how much an investment outperforms or underperforms
on a risk-adjusted basis relative to its benchmark.Beta is a measure of price variability relative to the market. Sharpe Ratio is a measure
of excess reward per unit of volatility. Correlation is a measure of the similarity of performance.
MSCI EMU Index - The Index is a free float-adjusted market capitalization-weighted index that is designed to measure the equity market performance of countries within the European Economic and Monetary Union (EMU). Nasdaq Eurozone™ Index - The Index is a float adjusted market capitalization-weighted index designed to track the performance of securities assigned to the Eurozone.
|
|
The information presented is not intended to constitute an investment recommendation for, or advice to, any specific person. By providing this information, First Trust is not undertaking to give advice in any fiduciary capacity within the meaning of ERISA, the Internal Revenue Code or any other regulatory framework. Financial professionals are responsible for evaluating investment risks independently and for exercising independent judgment in determining whether investments are appropriate for their clients.
|