|
|
 |
|
Investment Objective/Strategy - The First Trust Dorsey Wright Momentum & Dividend ETF, formerly the First Trust RBA Quality Income ETF, seeks investment results that correspond generally to the price and yield (before the Fund's fees and expenses) of an index called the Dorsey Wright Momentum Plus Dividend Yield™ Index (the "Index"). Under normal conditions, the Fund will invest at least 90% of its net assets (including investment borrowings) in the equity securities that comprise the Index. The Fund, using an indexing investment approach, attempts to replicate, before fees and expenses, the performance of the Index. The Fund's investment advisor seeks a correlation of 0.95 or better (before fees and expenses) between the Fund's performance and the performance of the Index; a figure of 1.00 would represent perfect correlation. The Index is owned and was developed by Nasdaq, Inc. (the "Index Provider").
There can be no assurance that the Fund's investment objectives will be achieved.
- The Dorsey Wright Momentum Plus Dividend Yield™ Index is a rules-based equity index that is designed to track the overall performance of the 50 highest dividend yielding stocks within the Nasdaq US Large Mid™ Index that maintain high levels of relative strength.
- To construct the index, Dorsey, Wright & Associates (DWA) begins with the eligible constituents of the Nasdaq US Large Mid™ Index.
- These eligible constituents are determined after meeting certain criteria, including maintaining a minimum average daily dollar volume of $1 million for the 30-day period prior to evaluation.
- Each security is assigned a relative strength score based on its forward price momentum compared to the momentum of a broad market benchmark index. Securities that exhibit a minimum level of relative strength are eligible for inclusion in the index.
- Eligible securities are then ranked based upon their current dividend yield, and the top 50 securities with the highest dividend yield are selected for inclusion in the index.
- The securities are then weighted, with greater weights given to securities with higher dividend yields.
- The index is reconstituted and rebalanced quarterly.
| Ticker | DDIV |
| Fund Type | Large Value |
| Investment Advisor | First Trust Advisors L.P. |
| Investor Servicing Agent | Bank of New York Mellon Corp |
| CUSIP | 33738R696 |
| ISIN | US33738R6962 |
| Intraday NAV | DDIVIV |
| Fiscal Year-End | 09/30 |
| Exchange | Nasdaq |
| Inception | 3/10/2014 |
| Inception Price | $20.00 |
| Inception NAV | $20.00 |
| Rebalance Frequency | Quarterly |
| Total Expense Ratio* | 0.60% |
* As of 2/2/2026
| Closing NAV1 | $47.36 |
| Closing Market Price2 | $47.33 |
| Bid/Ask Midpoint | $47.36 |
| Bid/Ask Premium | 0.00% |
| 30-Day Median Bid/Ask Spread3 | 0.16% |
| Total Net Assets | $71,040,767 |
| Outstanding Shares | 1,500,002 |
| Daily Volume | 3,778 |
| Average 30-Day Daily Volume | 3,650 |
| Closing Market Price 52-Week High/Low | $47.33 / $37.90 |
| Closing NAV 52-Week High/Low | $47.36 / $37.93 |
| Number of Holdings (excluding cash) | 50 |
| Holding |
Percent |
| AGNC Investment Corp. |
5.61% |
| Omega Healthcare Investors, Inc. |
4.62% |
| Edison International |
3.77% |
| Invesco Ltd. |
3.67% |
| HF Sinclair Corp. |
3.57% |
| U.S. Bancorp |
3.44% |
| Philip Morris International Inc. |
3.36% |
| Antero Midstream Corp. |
2.93% |
| Iron Mountain Incorporated |
2.91% |
| Watsco, Inc. |
2.63% |
* Excluding cash.
Holdings are subject to change.
Past performance is not indicative of future results.
| Maximum Market Cap. | $877,084 |
| Median Market Cap. | $45,919 |
| Minimum Market Cap. | $9,570 |
| Price/Earnings | 17.60 |
| Price/Book | 2.15 |
| Price/Cash Flow | 10.96 |
| Price/Sales | 1.78 |
|
|
2025 |
Q1 2026 |
Q2 2026 |
Q3 2026 |
| Days Traded at Premium |
108 |
27 |
46 |
7 |
| Days Traded at Discount |
142 |
34 |
16 |
4 |
|
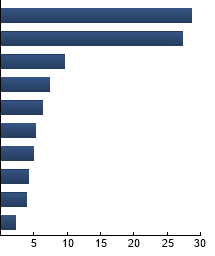
Financials
|
28.72%
|
|
Energy
|
27.37%
|
|
Real Estate
|
9.65%
|
|
Consumer Staples
|
7.38%
|
|
Industrials
|
6.30%
|
|
Utilities
|
5.30%
|
|
Materials
|
4.88%
|
|
Consumer Discretionary
|
4.16%
|
|
Health Care
|
3.93%
|
|
Communication Services
|
2.31%
|
|
|
Tracking Index: Dorsey Wright Momentum Plus Dividend Yield™ Index
| |
Standard Deviation |
Alpha |
Beta |
Sharpe Ratio |
Correlation |
| DDIV |
15.07% |
0.57 |
0.91 |
0.96 |
0.79 |
| Dow Jones U.S. Select Dividend Index |
12.96% |
2.55 |
0.57 |
0.87 |
0.58 |
| S&P 500® Index |
13.05% |
--- |
1.00 |
1.16 |
1.00 |
Standard Deviation is a measure of price variability (risk). Alpha is an indication of how much an investment outperforms or underperforms
on a risk-adjusted basis relative to its benchmark.Beta is a measure of price variability relative to the market. Sharpe Ratio is a measure
of excess reward per unit of volatility. Correlation is a measure of the similarity of performance.
Dow Jones U.S. Select Dividend Index - The Index consists of 100 widely-traded, dividend-paying stocks derived from the Dow Jones U.S.Total Market IndexSM. S&P 500® Index - The Index is an unmanaged index of 500 companies used to measure large-cap U.S. stock market performance.
|
|
The information presented is not intended to constitute an investment recommendation for, or advice to, any specific person. By providing this information, First Trust is not undertaking to give advice in any fiduciary capacity within the meaning of ERISA, the Internal Revenue Code or any other regulatory framework. Financial professionals are responsible for evaluating investment risks independently and for exercising independent judgment in determining whether investments are appropriate for their clients.
|