|
|
 |
|
Investment Objective/Strategy - The First Trust Senior Loan Fund is an actively managed exchange-traded fund. The fund's primary investment objective is to provide high current income by investing primarily in a diversified portfolio of first lien senior floating-rate bank loans ("Senior Loans"). The fund's secondary investment objective is the preservation of capital. Under normal market conditions, the fund will invest in at least 80% of its net assets in Senior Loans that are made predominantly to businesses operating in North America and may also invest up to 20% of its net assets in non-Senior Loan debt securities, warrants, equity securities and securities of other investment companies.
There can be no assurance that the Fund's investment objectives will be achieved.
| Ticker | FTSL |
| Fund Type | Senior Loan |
| Investment Advisor | First Trust Advisors L.P. |
| Investor Servicing Agent | Bank of New York Mellon Corp |
| CUSIP | 33738D309 |
| ISIN | US33738D3098 |
| Intraday NAV | FTSLIV |
| Fiscal Year-End | 10/31 |
| Exchange | Nasdaq |
| Inception | 5/1/2013 |
| Inception Price | $50.00 |
| Inception NAV | $50.00 |
| Total Expense Ratio* | 0.70% |
* As of 3/2/2026
| Closing NAV1 | $44.93 |
| Closing Market Price2 | $44.94 |
| Bid/Ask Midpoint | $44.95 |
| Bid/Ask Premium | 0.03% |
| 30-Day Median Bid/Ask Spread3 | 0.04% |
| Total Net Assets | $2,300,497,033 |
| Outstanding Shares | 51,200,002 |
| Daily Volume | 181,206 |
| Average 30-Day Daily Volume | 220,070 |
| Closing Market Price 52-Week High/Low | $46.18 / $44.51 |
| Closing NAV 52-Week High/Low | $46.23 / $44.67 |
| Number of Holdings (excluding cash) | 313 |
| Holding |
Percent |
| WHATABRANDS LLC WHABRA TL B 1L USD |
2.11% |
| IRB HOLDING CORP ARGIHC TL B 1L USD |
1.58% |
| WHITE CAP BUYER LLC WHTCAP TL B 1L USD |
1.28% |
| ATHENAHEALTH GROUP INC ATHENA TL B 1L USD |
1.26% |
| TAMKO BUILDING PRODUCTS INC TAMBUI TL B 1L USD |
1.24% |
| TRANSDIGM INC TDG TL K 1L USD |
1.23% |
| QUIKRETE HOLDINGS INC QUIKHO TL B 1L USD |
1.18% |
| POST HOLDINGS INC 6.25%, due 02/15/2032 |
1.15% |
| ACRISURE LLC ACRISU TL B 1L USD |
1.13% |
| 1011778 BC ULC BCULC TL B5 1L USD |
1.09% |
* Excluding cash.
Holdings are subject to change.
| Weighted Average Effective Duration8 | 0.63 Years |
| Weighted Average Maturity | 4.59 Years |
| Weighted Average Price | $97.96 |
| Weighted Average Coupon | 6.47% |
| Weighted Average Yield-To-Maturity9 | 6.90% |
| Weighted Average Yield-to-Worst10 | 6.68% |
| Days to Reset11 | 3 Days |
| 3-Month Term SOFR12 | 3.66% |
| Percent of Assets with Interest Rate Floors | 28.94% |
Please note: Weighted average maturity excludes defaulted assets. Weighted average price excludes equity prices.
| Asset |
Percent |
| Loan |
87.72% |
| Bond |
12.28% |
| Equity |
0.00% |
Please note that percentage of 0.00 indicates an amount less than 0.01%.
| Credit Quality |
Percent |
| BBB- |
3.34% |
| BB+ |
4.14% |
| BB |
9.33% |
| BB- |
14.98% |
| B+ |
12.57% |
| B |
33.64% |
| B- |
15.30% |
| CCC+ |
4.95% |
| CCC |
0.25% |
| NR |
1.50% |
The ratings are by S&P Global Ratings. A credit rating is an assessment provided by a nationally recognized statistical rating organization (NRSRO) of the creditworthiness of an issuer with respect to debt obligations except for those debt obligations that are only privately rated. Ratings are measured on a scale that generally ranges from AAA (highest) to D (lowest). Investment grade is defined as those issuers that have a long-term credit rating of BBB- or higher. "NR" indicates no rating. The credit ratings shown relate to the creditworthiness of the issuers of the underlying securities in the Fund, and not to the Fund or its shares. Credit ratings are subject to change.
|
|
2025 |
Q1 2026 |
Q2 2026 |
Q3 2026 |
| Days Traded at Premium |
80 |
8 |
38 |
--- |
| Days Traded at Discount |
170 |
53 |
3 |
--- |
|
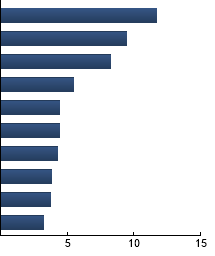
Insurance
|
11.71%
|
|
Software
|
9.42%
|
|
Hotels, Restaurants & Leisure
|
8.26%
|
|
Health Care Providers & Services
|
5.51%
|
|
Media
|
4.44%
|
|
Commercial Services & Supplies
|
4.40%
|
|
Trading Companies & Distributors
|
4.24%
|
|
Construction Materials
|
3.80%
|
|
Machinery
|
3.77%
|
|
Capital Markets
|
3.20%
|
|
|
| |
Standard Deviation |
Alpha |
Beta |
Sharpe Ratio |
Correlation |
| FTSL |
2.00% |
-0.46 |
0.89 |
1.25 |
0.92 |
| Morningstar® LSTA® US Leveraged Loan Index |
2.06% |
--- |
1.00 |
1.63 |
1.00 |
Standard Deviation is a measure of price variability (risk). Alpha is an indication of how much an investment outperforms or underperforms
on a risk-adjusted basis relative to its benchmark.Beta is a measure of price variability relative to the market. Sharpe Ratio is a measure
of excess reward per unit of volatility. Correlation is a measure of the similarity of performance.
Bloomberg US Aggregate Bond Index - The Index covers the investment-grade, U.S. dollar-denominated, fixed-rate taxable bond market, including Treasuries, government-related and corporate securities, MBS, ABS, and CMBS. Morningstar® LSTA® US Leveraged Loan Index - The Index, formerly the S&P/LSTA Leveraged Loan Index, is a market value-weighted index that is designed to deliver comprehensive, precise coverage of the US leveraged loan market.
|
|
The information presented is not intended to constitute an investment recommendation for, or advice to, any specific person. By providing this information, First Trust is not undertaking to give advice in any fiduciary capacity within the meaning of ERISA, the Internal Revenue Code or any other regulatory framework. Financial professionals are responsible for evaluating investment risks independently and for exercising independent judgment in determining whether investments are appropriate for their clients.
|