|
|
 |
|
-
2026 Estimated Capital Gain Distributions
Certain First Trust First Trust Exchange-Traded Funds are expected to pay a long-term capital gain distribution in December. For a list of exchange-traded funds expected to pay a long-term capital gain distribution, please click here. Also, certain First Trust Exchange-Traded Funds are expected to pay short-term capital gain distributions in December. For a list of exchange-traded funds expected to pay a short-term capital gain distribution, please click here. Final determination of the source and tax status of all distributions paid in the current year are to be made after year-end and could differ from the expectations noted above.
Investment Objective/Strategy - The Fund's investment objective is to provide current income. The Fund will pursue its investment objective by investing primarily in equity securities listed on U.S. exchanges and by utilizing an "option strategy" consisting of writing (selling) U.S. exchange-traded covered call options on the Nasdaq-100 Index. The Fund will employ an option strategy in which it will write U.S. exchange-traded covered call options on the Nasdaq-100 Index in order to seek additional cash flow in the form of premiums on the options. A premium is the income received by an investor who sells an option contract to another party and may be distributed to shareholders on a monthly basis.
There can be no assurance that the Fund's investment objectives will be achieved.
| Ticker | FTQI |
| Fund Type | Equity Income |
| Investment Advisor | First Trust Advisors L.P. |
| Investor Servicing Agent | Bank of New York Mellon Corp |
| CUSIP | 33738R407 |
| ISIN | US33738R4074 |
| Intraday NAV | FTQIIV |
| Fiscal Year-End | 12/31 |
| Exchange | Nasdaq |
| Inception | 1/6/2014 |
| Inception Price | $19.93 |
| Inception NAV | $19.93 |
| Total Expense Ratio* | 0.75% |
* As of 5/1/2026
| Closing NAV1 | $21.16 |
| Closing Market Price2 | $21.19 |
| Bid/Ask Midpoint | $21.17 |
| Bid/Ask Premium | 0.02% |
| 30-Day Median Bid/Ask Spread3 | 0.05% |
| Total Net Assets | $978,582,875 |
| Outstanding Shares | 46,250,002 |
| Daily Volume | 631,910 |
| Average 30-Day Daily Volume | 523,032 |
| Closing Market Price 52-Week High/Low | $22.48 / $19.33 |
| Closing NAV 52-Week High/Low | $22.50 / $19.31 |
| Number of Holdings (excluding cash) | 181 |
| Holding |
Percent |
| Apple Inc. |
9.56% |
| NVIDIA Corporation |
5.15% |
| Advanced Micro Devices, Inc. |
4.65% |
| Amazon.com, Inc. |
4.64% |
| Cisco Systems, Inc. |
3.00% |
| Tesla, Inc. |
2.94% |
| Meta Platforms, Inc. (Class A) |
2.79% |
| Palantir Technologies Inc. (Class A) |
2.54% |
| Alphabet Inc. (Class A) |
1.79% |
| Alphabet Inc. (Class C) |
1.79% |
* Excluding cash.
Holdings are subject to change.
Past performance is not indicative of future results.
 Among 88 funds in the US Fund Derivative Income - Diversified category. This fund was rated 4 stars/88 funds (3 years), 5 stars/69 funds (5 years), 3 stars/40 funds (10 years) based on risk adjusted returns.
| Maximum Market Cap. | $5,029,592 |
| Median Market Cap. | $25,118 |
| Minimum Market Cap. | $323 |
| Price/Earnings | 27.71 |
| Price/Book | 6.57 |
| Price/Cash Flow | 21.73 |
| Price/Sales | 4.45 |
Market cap and price ratio statistics are for the equity portion of the fund and exclude cash and options.
| Average Time Until Expiration of Calls | 30 Days |
| Average Call Moneyness (OTM) | 6.17% |
| Option Overwrite % | 65.78% |
Moneyness is how much an option contract's strike price is in-the-money (ITM) or out-of-the-money (OTM) expressed as a percentage of the price of the option contract's underlying asset. Option Overwrite % is the percentage of the net asset value used for writing of call options against a long position at each monthly call selling date.
|
|
2025 |
Q1 2026 |
Q2 2026 |
Q3 2026 |
| Days Traded at Premium |
188 |
46 |
41 |
52 |
| Days Traded at Discount |
62 |
15 |
21 |
12 |
|
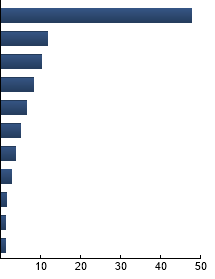
Information Technology
|
47.83%
|
|
Consumer Discretionary
|
11.83%
|
|
Health Care
|
10.34%
|
|
Communication Services
|
8.17%
|
|
Financials
|
6.51%
|
|
Industrials
|
4.96%
|
|
Consumer Staples
|
3.78%
|
|
Energy
|
2.65%
|
|
Utilities
|
1.40%
|
|
Materials
|
1.34%
|
|
Real Estate
|
1.26%
|
|
|
| |
Standard Deviation |
Alpha |
Beta |
Sharpe Ratio |
Correlation |
| FTQI |
9.34% |
2.32 |
0.98 |
1.40 |
0.85 |
| Cboe Nasdaq-100 BuyWrite™ Index |
8.05% |
--- |
1.00 |
1.36 |
1.00 |
Standard Deviation is a measure of price variability (risk). Alpha is an indication of how much an investment outperforms or underperforms
on a risk-adjusted basis relative to its benchmark.Beta is a measure of price variability relative to the market. Sharpe Ratio is a measure
of excess reward per unit of volatility. Correlation is a measure of the similarity of performance.
Cboe Nasdaq-100 BuyWrite™ Index - The Index measures the total rate of return of a Nasdaq-100 covered call strategy that consists of holding a portfolio indexed to the Nasdaq-100 and selling a succession of one-month at-the-money Nasdaq-100 (NDX) call options listed on the PHLX exchange. Nasdaq-100 Index® - The Index includes 100 of the largest domestic and international non-financial companies listed on The Nasdaq Stock Market based on market capitalization. S&P 500® Index - The Index is an unmanaged index of 500 companies used to measure large-cap U.S. stock market performance.
|
|
The information presented is not intended to constitute an investment recommendation for, or advice to, any specific person. By providing this information, First Trust is not undertaking to give advice in any fiduciary capacity within the meaning of ERISA, the Internal Revenue Code or any other regulatory framework. Financial professionals are responsible for evaluating investment risks independently and for exercising independent judgment in determining whether investments are appropriate for their clients.
|