|
|
 |
|
Investment Objective/Strategy - First Trust International Rising Dividend Achievers ETF seeks investment results that correspond generally to the price and yield (before the Fund's fees and expenses) of an equity index called the Nasdaq International Rising Dividend Achievers™ Index (the "Index"). The Fund will invest at least 80% of its net assets (plus any borrowings for investment purposes) in the securities that comprise the Index. The Fund, using an indexing investment approach, attempts to replicate, before fees and expenses, the performance of the Index. According to the Index Provider, the Index measures the performance of securities from developed markets outside the U.S. that have raised their dividend value over the past three and five years and have increased their earnings-per-share over the past three years.
There can be no assurance that the Fund's investment objectives will be achieved.
- The First Trust International Rising Dividend Achievers ETF (IDVY) is based on the Nasdaq International Rising Dividend Achievers™ Index (the “index”) and is comprised of four sub-portfolios.
- The selection process for each sub-portfolio begins with the stocks in the Nasdaq DM Ex United States™ Index and eliminates those companies classified as a Mortgage Real Estate Investment Trust or a Real Estate Investment Trust (REIT) by the Industry Classification Benchmark. Companies must also meet the size and liquidity requirements of the Nasdaq DM Ex United States™ Index.
- According to the index provider, every security must meet stringent eligibility criteria. The following factors are screened:
- Dividend Growth: Every company must have paid a dividend in the trailing twelve-month period greater than the dividend paid in the trailing twelve-month period three and five years prior.
- Positive and Growing Earnings Per Share: Every company must have positive earnings-per-share in the trailing twelve-month period greater than the earnings-per-share in the trailing twelve-month period for the three years prior.
- Cash to Debt Ratio: Every company must have a cash to debt ratio greater than 50%.
- Payout Ratio: Every company must have a trailing twelve-month period payout ratio less than 65%.
- Eligible securities are ranked by a combined factor of dollar dividend increase over the previous five year period, current dividend yield, and payout ratio.
- Up to 100 securities with the lowest (most favorable) combined ranks are selected for inclusion in each sub-portfolio, subject to a maximum 30% in a single Industry Classification Benchmark industry and 33% in a single country of domicile.
- One sub-portfolio is reconstituted and rebalanced in March, June, September and December.
- The reconstituted sub-portfolio is then combined with the sub-portfolios not undergoing a reconstitution to form the index.
- The index is rebalanced annually so that each of the four sub-portfolios is equally weighted among each other, each representing 25% of the total index weight.
| Ticker | IDVY |
| Fund Type | International Equity |
| Investment Advisor | First Trust Advisors L.P. |
| Investor Servicing Agent | Bank of New York Mellon Corp |
| CUSIP | 33741X300 |
| ISIN | US33741X3008 |
| Fiscal Year-End | 09/30 |
| Exchange | Nasdaq |
| Inception | 2/10/2026 |
| Inception Price | $25.13 |
| Inception NAV | $25.13 |
| Rebalance Frequency | Quarterly |
| Total Expense Ratio* | 0.60% |
* As of 2/11/2026
| Closing NAV1 | $25.44 |
| Closing Market Price2 | $25.52 |
| Bid/Ask Midpoint | $25.50 |
| Bid/Ask Premium | 0.24% |
| 30-Day Median Bid/Ask Spread3 | 0.35% |
| Total Net Assets | $1,271,885 |
| Outstanding Shares | 50,002 |
| Daily Volume | 2 |
| Average 30-Day Daily Volume | 175 |
| Closing Market Price 52-Week High/Low | $26.50 / $22.42 |
| Closing NAV 52-Week High/Low | $26.32 / $22.44 |
| Number of Holdings (excluding cash) | 152 |
| Holding |
Percent |
| Sumitomo Electric Industries, Ltd. |
1.74% |
| SCREEN Holdings Co., Ltd. |
1.61% |
| Niterra Co. Ltd. |
1.58% |
| ASML Holding N.V. |
1.55% |
| Isetan Mitsukoshi Holdings Ltd. |
1.40% |
| Techtronic Industries Company Ltd. |
1.27% |
| Sumitomo Mitsui Financial Group, Inc. |
1.24% |
| Fujikura Ltd. |
1.19% |
| CaixaBank, S.A. |
1.18% |
| AIB Group Plc |
1.17% |
* Excluding cash.
Holdings are subject to change.
Past performance is not indicative of future results.
| Maximum Market Cap. | $1,099,022 |
| Median Market Cap. | $25,861 |
| Minimum Market Cap. | $5,420 |
| Price/Earnings | 14.75 |
| Price/Book | 1.86 |
| Price/Cash Flow | 10.87 |
| Price/Sales | 1.51 |
| Country |
Percent |
| Japan |
30.76% |
| France |
9.72% |
| Germany |
8.63% |
| South Korea |
7.36% |
| United Kingdom |
7.18% |
| The Netherlands |
4.27% |
| Hong Kong |
4.22% |
| Sweden |
3.34% |
| Israel |
3.31% |
| Singapore |
2.89% |
|
|
2025 |
Q1 2026 |
Q2 2026 |
Q3 2026 |
| Days Traded at Premium |
--- |
26 |
42 |
--- |
| Days Traded at Discount |
--- |
8 |
18 |
--- |
|
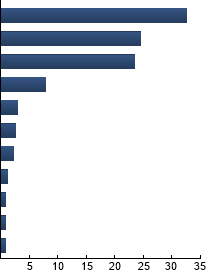
Financials
|
32.54%
|
|
Industrials
|
24.45%
|
|
Consumer Discretionary
|
23.43%
|
|
Technology
|
7.82%
|
|
Basic Materials
|
2.89%
|
|
Health Care
|
2.71%
|
|
Energy
|
2.33%
|
|
Telecommunications
|
1.24%
|
|
Consumer Staples
|
0.88%
|
|
Utilities
|
0.88%
|
|
Real Estate
|
0.83%
|
|
|
Tracking Index: Nasdaq International Rising Dividend Achievers™ Index
MSCI World ex USA Index - The Index includes developed markets and is designed to provide a broad measure of stock performance throughout the world, with the exception of U.S.-based companies.
|
|
The information presented is not intended to constitute an investment recommendation for, or advice to, any specific person. By providing this information, First Trust is not undertaking to give advice in any fiduciary capacity within the meaning of ERISA, the Internal Revenue Code or any other regulatory framework. Financial professionals are responsible for evaluating investment risks independently and for exercising independent judgment in determining whether investments are appropriate for their clients.
|