|
|
 |
|
Investment Objective/Strategy - The First Trust Tactical High Yield ETF is an actively managed exchange-traded fund. The fund's primary investment objective is to provide current income. The fund's secondary investment objective is to provide capital appreciation. Under normal market conditions, the fund invests at least 80% of its net assets (plus the amount of any borrowing for investment purposes) in high yield debt securities that are rated below investment grade at the time of purchase or unrated securities deemed by the fund's advisor to be of comparable quality.
There can be no assurance that the Fund's investment objectives will be achieved.
| Ticker | HYLS |
| Fund Type | High Yield Bond |
| Investment Advisor | First Trust Advisors L.P. |
| Investor Servicing Agent | Bank of New York Mellon Corp |
| CUSIP | 33738D408 |
| ISIN | US33738D4088 |
| Intraday NAV | HYLSIV |
| Fiscal Year-End | 10/31 |
| Exchange | Nasdaq |
| Inception | 2/25/2013 |
| Inception Price | $50.00 |
| Inception NAV | $50.00 |
| Management Fees | 0.69% |
| Total Expense Ratio | 0.69% |
As of Date 3/2/2026
| Closing NAV1 | $40.78 |
| Closing Market Price2 | $40.80 |
| Bid/Ask Midpoint | $40.78 |
| Bid/Ask Premium | 0.00% |
| 30-Day Median Bid/Ask Spread3 | 0.07% |
| Total Net Assets | $1,639,301,863 |
| Outstanding Shares | 40,200,002 |
| Daily Volume | 180,912 |
| Average 30-Day Daily Volume | 145,928 |
| Closing Market Price 52-Week High/Low | $42.32 / $40.09 |
| Closing NAV 52-Week High/Low | $42.24 / $40.17 |
| Number of Holdings (excluding cash) | 327 |
| Holding |
Percent |
| ROCKET COS INC 6.375%, due 08/01/2033 |
1.56% |
| 1011778 BC / NEW RED FIN 4%, due 10/15/2030 |
1.47% |
| ONEDIGITAL BORROWER LLC Variable rate, due 07/02/2032 |
1.43% |
| UNITED RENTALS (NORTH AMERICA) 6%, due 12/15/2029 |
1.28% |
| QXO BUILDING PRODUCTS INC 6.75%, due 04/30/2032 |
1.21% |
| DISH NETWORK CORP 11.75%, due 11/15/2027 |
1.08% |
| QUIKRETE HOLDINGS INC 6.75%, due 03/01/2033 |
1.08% |
| FAIR ISAAC CORP 6%, due 05/15/2033 |
1.07% |
| BUILDERS FIRSTSOURCE INC 6.75%, due 05/15/2035 |
1.04% |
| VIKING OCEAN CRUISES SHIP VII LTD 5.625%, due 02/15/2029 |
1.03% |
* Excluding cash.
Holdings are subject to change.
| Net Weighted Average Effective Duration (Includes Short Positions)8 | 3.01 Years |
| Weighted Average Effective Duration (Long Positions)8 | 3.01 Years |
| Weighted Average Maturity (Long Positions) | 5.31 Years |
| Weighted Average Price | $98.64 |
| Weighted Average Coupon | 6.73% |
| Weighted Average Yield-To-Maturity9 | 7.26% |
| Weighted Average Yield-to-Worst10 | 6.91% |
| Long Positions | 102.89% |
| Short Position - U.S. Treasury Securities | 0.00% |
| Option-Adjusted Spread11 | 243 bps |
| 3-Month Term SOFR12 | 3.75% |
Portfolio information statistics exclude cash and other assets and liabilities. Weighted average maturity excludes defaulted assets.
| Asset |
Percent |
| Bond |
88.82% |
| Loan |
11.18% |
| Equity |
0.00% |
Please note that percentage of 0.00 indicates an amount less than 0.01%.
| Credit Quality |
Percent |
| BBB- |
4.77% |
| BB+ |
10.44% |
| BB |
14.64% |
| BB- |
16.18% |
| B+ |
11.44% |
| B |
19.81% |
| B- |
7.47% |
| CCC+ |
8.74% |
| CCC |
4.09% |
| NR |
2.42% |
The ratings are by S&P Global Ratings. A credit rating is an assessment provided by a nationally recognized statistical rating organization (NRSRO) of the creditworthiness of an issuer with respect to debt obligations except for those debt obligations that are only privately rated. Ratings are measured on a scale that generally ranges from AAA (highest) to D (lowest). Investment grade is defined as those issuers that have a long-term credit rating of BBB- or higher. "NR" indicates no rating. The credit ratings shown relate to the creditworthiness of the issuers of the underlying securities in the Fund, and not to the Fund or its shares. Credit ratings are subject to change.
|
|
2025 |
Q1 2026 |
Q2 2026 |
Q3 2026 |
| Days Traded at Premium |
163 |
42 |
34 |
1 |
| Days Traded at Discount |
87 |
19 |
28 |
1 |
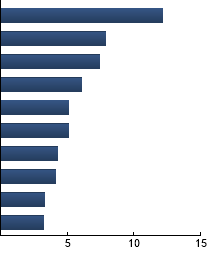
|
Insurance
|
12.14%
|
|
Hotels, Restaurants & Leisure
|
7.84%
|
|
Media
|
7.46%
|
|
Trading Companies & Distributors
|
6.10%
|
|
Health Care Providers & Services
|
5.10%
|
|
Software
|
5.09%
|
|
Financial Services
|
4.26%
|
|
Commercial Services & Supplies
|
4.10%
|
|
Food Products
|
3.29%
|
|
Building Products
|
3.23%
|
|
|
| |
Standard Deviation |
Alpha |
Beta |
Sharpe Ratio |
Correlation |
| HYLS |
4.74% |
-1.39 |
1.06 |
0.70 |
0.97 |
| ICE BofA US High Yield Constrained Index |
4.33% |
--- |
1.00 |
1.03 |
1.00 |
Standard Deviation is a measure of price variability (risk). Alpha is an indication of how much an investment outperforms or underperforms
on a risk-adjusted basis relative to its benchmark.Beta is a measure of price variability relative to the market. Sharpe Ratio is a measure
of excess reward per unit of volatility. Correlation is a measure of the similarity of performance.
Bloomberg US Aggregate Bond Index - The Index covers the investment-grade, U.S. dollar-denominated, fixed-rate taxable bond market, including Treasuries, government-related and corporate securities, MBS, ABS, and CMBS. ICE BofA US High Yield Constrained Index - The Index tracks the performance of U.S. dollar denominated below investment grade corporate debt publicly issued in the U.S. domestic market but caps issuer exposure at 2%.
|
|
The information presented is not intended to constitute an investment recommendation for, or advice to, any specific person. By providing this information, First Trust is not undertaking to give advice in any fiduciary capacity within the meaning of ERISA, the Internal Revenue Code or any other regulatory framework. Financial professionals are responsible for evaluating investment risks independently and for exercising independent judgment in determining whether investments are appropriate for their clients.
|