|
|
 |
|
Investment Objective/Strategy - The First Trust NASDAQ® Clean Edge® Smart Grid Infrastructure Index Fund is an exchange-traded fund. The Fund seeks investment results that correspond generally to the price and yield (before the Fund's fees and expenses) of an equity index called the Nasdaq Clean Edge Smart Grid Infrastructure™ Index.
There can be no assurance that the Fund's investment objectives will be achieved.
- The Index is designed to track the performance of common stocks in the grid and electric energy infrastructure sector.The index includes companies that are primarily engaged and involved in electric grid, electric meters and devices, networks, energy storage and management, and enabling software used by the smart grid infrastructure sector.
- To be included in the Index, a security must meet certain criteria including being classified as a smart grid, electric infrastructure and/or other grid-related activities company according to Clean Edge, have a minimum worldwide market capitalization of $100 million, have a minimum free float of 20%, and have a minimum three-month average daily dollar trading volume of $500 thousand.
- The Index employs a modified market-capitalization weighting methodology. At each evaluation, the Index securities are classified as Pure Play or Diversified. The Pure Play securities are given a collective weight of 80% and the Diversified securities are given a collective weight of 20% in the index.
- The Index is rebalanced quarterly and reconstituted semi-annually.
| Ticker | GRID |
| Fund Type | Global Equity |
| Investment Advisor | First Trust Advisors L.P. |
| Investor Servicing Agent | Bank of New York Mellon Corp |
| CUSIP | 33737A108 |
| ISIN | US33737A1088 |
| Intraday NAV | GRIDIV |
| Fiscal Year-End | 09/30 |
| Exchange | Nasdaq |
| Inception | 11/16/2009 |
| Inception Price | $30.00 |
| Inception NAV | $30.00 |
| Rebalance Frequency | Quarterly |
| Total Expense Ratio* | 0.56% |
| Net Expense Ratio* | 0.56% |
* As of 2/2/2026
Expenses are capped contractually at 0.70% per year, at least through January 31, 2027.
| Closing NAV1 | $187.58 |
| Closing Market Price2 | $188.36 |
| Bid/Ask Midpoint | $188.28 |
| Bid/Ask Premium | 0.37% |
| 30-Day Median Bid/Ask Spread (as of 6/26/2026)3 | 0.12% |
| Total Net Assets | $11,836,393,050 |
| Outstanding Shares | 63,100,002 |
| Daily Volume | 343,601 |
| Average 30-Day Daily Volume | 798,644 |
| Closing Market Price 52-Week High/Low | $199.80 / $138.08 |
| Closing NAV 52-Week High/Low | $198.55 / $137.95 |
| Number of Holdings (excluding cash) | 120 |
| Holding |
Percent |
| Eaton Corporation Plc |
8.32% |
| Schneider Electric SE |
8.26% |
| ABB Ltd |
8.08% |
| Quanta Services, Inc. |
8.00% |
| Johnson Controls International Plc |
7.82% |
| National Grid Plc |
4.22% |
| E.ON SE |
4.00% |
| Prysmian SpA |
3.90% |
| nVent Electric plc |
2.85% |
| Hubbell Incorporated |
2.66% |
* Excluding cash.
Holdings are subject to change.
Past performance is not indicative of future results.
 Among 81 funds in the Infrastructure category. This fund was rated 5 stars/81 funds (3 years), 5 stars/75 funds (5 years), 5 stars/50 funds (10 years) based on risk adjusted returns.
| Maximum Market Cap. | $5,113,922 |
| Median Market Cap. | $11,807 |
| Minimum Market Cap. | $424 |
| Price/Earnings | 32.24 |
| Price/Book | 4.46 |
| Price/Cash Flow | 19.87 |
| Price/Sales | 2.79 |
|
|
2025 |
Q1 2026 |
Q2 2026 |
Q3 2026 |
| Days Traded at Premium |
212 |
54 |
52 |
--- |
| Days Traded at Discount |
38 |
7 |
9 |
--- |
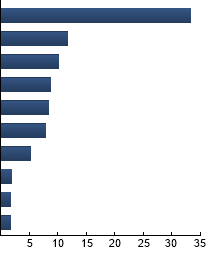
|
Electrical Components
|
33.19%
|
|
Diversified Industrials
|
11.72%
|
|
Engineering and Contracting Services
|
10.08%
|
|
Conventional Electricity
|
8.81%
|
|
Multi-utilities
|
8.47%
|
|
Electronic Equipment: Control and Filter
|
7.84%
|
|
Semiconductors
|
5.30%
|
|
Automobiles
|
1.95%
|
|
Software
|
1.81%
|
|
Telecommunications Equipment
|
1.68%
|
|
|
Tracking Index: Nasdaq Clean Edge Smart Grid Infrastructure™ Index
| |
Standard Deviation |
Alpha |
Beta |
Sharpe Ratio |
Correlation |
| GRID |
20.57% |
0.89 |
1.16 |
1.03 |
0.92 |
| MSCI World Industrials Index |
16.24% |
--- |
1.00 |
1.08 |
1.00 |
Standard Deviation is a measure of price variability (risk). Alpha is an indication of how much an investment outperforms or underperforms
on a risk-adjusted basis relative to its benchmark.Beta is a measure of price variability relative to the market. Sharpe Ratio is a measure
of excess reward per unit of volatility. Correlation is a measure of the similarity of performance.
MSCI World Industrials Index - The Index is a free float-adjusted market capitalization-weighted index that is designed to measure the industrials sector performance of 23 developed markets around the world. Russell 3000® Index - The Index is comprised of the 3000 largest and most liquid stocks based and traded in the U.S. S&P Composite 1500® Industrials Index - The Index is a capitalization-weighted index of companies classified by GICS as industrials within the S&P Composite 1500 Index.
|
|
The information presented is not intended to constitute an investment recommendation for, or advice to, any specific person. By providing this information, First Trust is not undertaking to give advice in any fiduciary capacity within the meaning of ERISA, the Internal Revenue Code or any other regulatory framework. Financial professionals are responsible for evaluating investment risks independently and for exercising independent judgment in determining whether investments are appropriate for their clients.
|