|
|
 |
|
Investment Objective/Strategy - The First Trust International Equity Opportunities ETF is an exchange-traded fund. The investment objective of the Fund is to seek investment results that correspond generally to the price and yield, before the Fund's fees and expenses, of an equity index called the IPOX® International Index.
There can be no assurance that the Fund's investment objectives will be achieved.
- The IPOX® International Index seeks exposure to 50 of the largest, most liquid and best performing non-US domiciled firms that have recently gone public, including initial public offerings (“IPOs”) and spin-offs, as well as select acquirers of recent IPOs.
- The index is based on the IPOX® Global Composite Index, which is a market-cap weighted index measuring the performance of all newly publicly listed companies worldwide during their first 1,000 trading days, subject to meeting initial listings characteristics and optimization rules.
- The index applies a 10% capping to all constituents and is reconstituted and rebalanced on a quarterly basis.
Potential Benefits of the First Trust International Equity Opportunities ETF
- Systematic exposure to equity capital market activity of non-U.S. domiciled firms trading around the world and their respective growth and innovativeness via a semi-passive indexing approach.
- Based on a proven, disciplined and transparent index methodology. Core position in large-cap stocks with tilt towards mid- and small-cap stocks.
- Innovative investment tool for various market participants, including buy-and-hold investors seeking timely and systematic exposure to newly listed companies as well as active market participants due to dynamic index properties and limited overlap with benchmarks.
- High correlation to private markets returns, including private equity, venture capital and pre-IPO of companies domiciled outside the United States.
| Ticker | FPXI |
| Fund Type | Growth |
| Investment Advisor | First Trust Advisors L.P. |
| Investor Servicing Agent | Bank of New York Mellon Corp |
| CUSIP | 33734X853 |
| ISIN | US33734X8535 |
| Intraday NAV | FPXIIV |
| Fiscal Year-End | 09/30 |
| Exchange | Nasdaq |
| Inception | 11/4/2014 |
| Inception Price | $30.00 |
| Inception NAV | $30.00 |
| Rebalance Frequency | Quarterly |
| Total Expense Ratio* | 0.70% |
* As of 2/2/2026
| Closing NAV1 | $68.53 |
| Closing Market Price2 | $68.79 |
| Bid/Ask Midpoint | $68.92 |
| Bid/Ask Premium | 0.57% |
| 30-Day Median Bid/Ask Spread3 | 0.53% |
| Total Net Assets | $274,116,561 |
| Outstanding Shares | 4,000,002 |
| Daily Volume | 13,707 |
| Average 30-Day Daily Volume | 88,627 |
| Closing Market Price 52-Week High/Low | $86.45 / $54.01 |
| Closing NAV 52-Week High/Low | $85.69 / $53.99 |
| Number of Holdings (excluding cash) | 50 |
| Holding |
Percent |
| Advantest Corporation |
9.64% |
| Contemporary Amperex Technology Co., Ltd. (Class H) |
8.86% |
| Kioxia Holdings Corporation |
5.96% |
| Siemens Energy AG |
4.92% |
| Arm Holdings Plc |
4.54% |
| Rio Tinto plc (ADR) |
4.40% |
| Caixa Seguridade Participacoes SA |
3.67% |
| Viking Holdings Ltd |
3.15% |
| Sandoz Group AG |
3.00% |
| Hochtief AG |
2.70% |
* Excluding cash.
Holdings are subject to change.
| Country |
Percent |
| Japan |
20.99% |
| China |
17.80% |
| United Kingdom |
9.56% |
| Germany |
9.11% |
| Canada |
6.54% |
| Switzerland |
5.66% |
| Taiwan |
4.04% |
| Brazil |
3.68% |
| Italy |
3.40% |
| Bermuda |
3.16% |
Past performance is not indicative of future results.
 Among 350 funds in the Foreign Large Growth category. This fund was rated 5 stars/350 funds (3 years), 3 stars/333 funds (5 years), 5 stars/223 funds (10 years) based on risk adjusted returns.
| Maximum Market Cap. | $378,709 |
| Median Market Cap. | $17,749 |
| Minimum Market Cap. | $5,951 |
| Price/Earnings | 37.14 |
| Price/Book | 6.12 |
| Price/Cash Flow | 22.12 |
| Price/Sales | 3.99 |
|
|
2025 |
Q1 2026 |
Q2 2026 |
Q3 2026 |
| Days Traded at Premium |
94 |
34 |
42 |
6 |
| Days Traded at Discount |
156 |
27 |
20 |
7 |
|
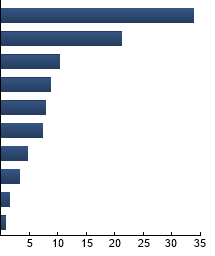
Information Technology
|
33.77%
|
|
Industrials
|
21.25%
|
|
Health Care
|
10.36%
|
|
Materials
|
8.83%
|
|
Financials
|
7.92%
|
|
Consumer Discretionary
|
7.34%
|
|
Energy
|
4.74%
|
|
Consumer Staples
|
3.40%
|
|
Communication Services
|
1.56%
|
|
Utilities
|
0.83%
|
|
|
Tracking Index: IPOX® International Index
| |
Standard Deviation |
Alpha |
Beta |
Sharpe Ratio |
Correlation |
| FPXI |
20.31% |
6.71 |
1.20 |
1.14 |
0.82 |
| MSCI ACWI ex USA Index |
13.87% |
--- |
1.00 |
0.99 |
1.00 |
Standard Deviation is a measure of price variability (risk). Alpha is an indication of how much an investment outperforms or underperforms
on a risk-adjusted basis relative to its benchmark.Beta is a measure of price variability relative to the market. Sharpe Ratio is a measure
of excess reward per unit of volatility. Correlation is a measure of the similarity of performance.
MSCI ACWI ex USA Index - The Index captures large- and mid-cap representation across Developed Markets countries (excluding the United States) and Emerging Markets countries.
|
|
The information presented is not intended to constitute an investment recommendation for, or advice to, any specific person. By providing this information, First Trust is not undertaking to give advice in any fiduciary capacity within the meaning of ERISA, the Internal Revenue Code or any other regulatory framework. Financial professionals are responsible for evaluating investment risks independently and for exercising independent judgment in determining whether investments are appropriate for their clients.
|