|
|
 |
|
Investment Objective/Strategy - The First Trust Nasdaq-100 Select Equal Weight ETF (the "Fund") seeks investment results that correspond generally to the price and yield (before the Fund's fees and expenses) of an equity index called the Nasdaq-100 Select Equal Weight™ Index (the "Index"). The Fund will normally invest at least 80% of its net assets (including investment borrowings) in the securities that comprise the Index.
There can be no assurance that the Fund's investment objectives will be achieved.
- The index begins with a universe of 100 Nasdaq-listed companies comprising the Nasdaq-100 Index®.
- To be eligible for inclusion in the Nasdaq-100 Index®, companies must meet certain eligibility and liquidity criteria and must not be issued by a company classified as being in the financials industry.
- For each constituent of the Nasdaq-100 Index®, a “Blended Quality and Growth Score” is calculated by determining the equal-weighted average of each eligible security’s Growth Score and Quality Score which are calculated as follows:
- Growth Score - The average across the following three metrics, after they are normalized: (i) the 3-year revenue annualized growth rate; (ii) the 3-year forward earnings per share estimate annualized growth rate; and (iii) the 3-year free cash flow annualized growth rate.
- Quality Score - The average across the following two metrics, after they are normalized: (i) return on equity; and (ii) profit margin.
- The top 50 companies with the highest Blended Quality and Growth Score are selected for inclusion in the index and are equally weighted.
- The index is rebalanced and reconstituted quarterly.
| Ticker | QQEW |
| Fund Type | Growth |
| Investment Advisor | First Trust Advisors L.P. |
| Investor Servicing Agent | Bank of New York Mellon Corp |
| CUSIP | 337344105 |
| ISIN | US3373441050 |
| Intraday NAV | QQEWIV |
| Fiscal Year-End | 12/31 |
| Exchange | Nasdaq |
| Inception | 4/19/2006 |
| Inception Price | $20.00 |
| Inception NAV | $20.00 |
| Rebalance Frequency | Quarterly |
| Total Expense Ratio* | 0.55% |
* As of 5/1/2026
| Closing NAV1 | $151.05 |
| Closing Market Price2 | $151.03 |
| Bid/Ask Midpoint | $151.06 |
| Bid/Ask Premium | 0.00% |
| 30-Day Median Bid/Ask Spread (as of 7/23/2026)3 | 0.06% |
| Total Net Assets | $1,699,336,991 |
| Outstanding Shares | 11,250,002 |
| Daily Volume | 39,027 |
| Average 30-Day Daily Volume | 36,704 |
| Closing Market Price 52-Week High/Low | $161.85 / $123.05 |
| Closing NAV 52-Week High/Low | $161.92 / $123.05 |
| Number of Holdings (excluding cash) | 51 |
| Holding |
Percent |
| Paychex, Inc. |
2.43% |
| Palo Alto Networks, Inc. |
2.38% |
| Automatic Data Processing, Inc. |
2.34% |
| Roper Technologies, Inc. |
2.34% |
| Amgen Inc. |
2.32% |
| Axon Enterprise Inc. |
2.32% |
| Fortinet, Inc. |
2.29% |
| KLA Corporation |
2.27% |
| ASML Holding N.V. (New York Registry Shares) |
2.26% |
| DoorDash, Inc. (Class A) |
2.25% |
* Excluding cash.
Holdings are subject to change.
Past performance is not indicative of future results.
| Maximum Market Cap. | $4,846,285 |
| Median Market Cap. | $126,073 |
| Minimum Market Cap. | $25,989 |
| Price/Earnings | 36.43 |
| Price/Book | 9.35 |
| Price/Cash Flow | 29.05 |
| Price/Sales | 7.61 |
|
|
2025 |
Q1 2026 |
Q2 2026 |
Q3 2026 |
| Days Traded at Premium |
52 |
17 |
4 |
4 |
| Days Traded at Discount |
198 |
44 |
58 |
13 |
|
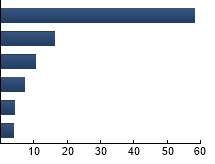
Technology
|
58.17%
|
|
Health Care
|
16.28%
|
|
Consumer Discretionary
|
10.45%
|
|
Industrials
|
7.09%
|
|
Consumer Staples
|
4.17%
|
|
Telecommunications
|
3.84%
|
|
|
Tracking Index: Nasdaq-100 Select Equal Weight Index
| |
Standard Deviation |
Alpha |
Beta |
Sharpe Ratio |
Correlation |
| QQEW |
16.24% |
-6.04 |
1.10 |
0.66 |
0.88 |
| Nasdaq-100 Index® |
17.10% |
2.07 |
1.24 |
1.22 |
0.94 |
| S&P 500® Index |
13.05% |
--- |
1.00 |
1.16 |
1.00 |
Standard Deviation is a measure of price variability (risk). Alpha is an indication of how much an investment outperforms or underperforms
on a risk-adjusted basis relative to its benchmark.Beta is a measure of price variability relative to the market. Sharpe Ratio is a measure
of excess reward per unit of volatility. Correlation is a measure of the similarity of performance.
Nasdaq-100 Index® - The Index includes 100 of the largest domestic and international non-financial companies listed on The Nasdaq Stock Market based on market capitalization. Nasdaq-100 Equal Weighted™ Index - The Index is the equal weighted version of the Nasdaq-100 Index® which includes 100 of the largest non-financial securities listed on The Nasdaq Stock Market based on market capitalization. S&P 500® Index - The Index is an unmanaged index of 500 companies used to measure large-cap U.S. stock market performance.
|
|
The information presented is not intended to constitute an investment recommendation for, or advice to, any specific person. By providing this information, First Trust is not undertaking to give advice in any fiduciary capacity within the meaning of ERISA, the Internal Revenue Code or any other regulatory framework. Financial professionals are responsible for evaluating investment risks independently and for exercising independent judgment in determining whether investments are appropriate for their clients.
|