|
|
 |
|
Investment Objective/Strategy - The First Trust Limited Duration Investment Grade Corporate ETF's (the "Fund") primary investment objective is to deliver current income. Under normal market conditions, the Fund seeks to achieve its objectives by investing at least 80% of its net assets (plus any borrowings for investment purposes) in investment grade corporate debt securities. Corporate debt securities are debt obligations issued by businesses to finance their operations. Notes, bonds, loans, debentures and commercial paper are the most common types of corporate debt securities, with the primary differences being their maturities and secured or unsecured status. Commercial paper has the shortest term and is usually unsecured. Corporate debt securities may have fixed or floating interest rates. The corporate debt securities in which the Fund may investment may include senior loans.
There can be no assurance that the Fund's investment objectives will be achieved.
| Ticker | FSIG |
| Fund Type | Short Maturity |
| Investment Advisor | First Trust Advisors L.P. |
| Investor Servicing Agent | Bank of New York Mellon Corp |
| CUSIP | 33738D804 |
| ISIN | US33738D8048 |
| Intraday NAV | FSIGIV |
| Fiscal Year-End | 10/31 |
| Exchange | NYSE Arca |
| Inception | 11/17/2021 |
| Inception Price | $20.00 |
| Inception NAV | $20.00 |
| Total Expense Ratio* | 0.44% |
* As of 3/2/2026
| Closing NAV1 | $18.86 |
| Closing Market Price2 | $18.83 |
| Bid/Ask Midpoint | $18.83 |
| Bid/Ask Discount | 0.16% |
| 30-Day Median Bid/Ask Spread3 | 0.05% |
| Total Net Assets | $1,556,557,348 |
| Outstanding Shares | 82,550,002 |
| Daily Volume | 2,153,831 |
| Average 30-Day Daily Volume | 445,127 |
| Closing Market Price 52-Week High/Low | $19.33 / $18.81 |
| Closing NAV 52-Week High/Low | $19.29 / $18.80 |
| Number of Holdings (excluding cash) | 328 |
| Holding |
Percent |
| MSCI INC 4%, due 11/15/2029 |
1.48% |
| CROWDSTRIKE HOLDINGS INC 3%, due 02/15/2029 |
1.37% |
| FAIR ISAAC CORP 6%, due 05/15/2033 |
1.01% |
| ENERGY TRANSFER LP 0%, due 07/08/2026 |
0.98% |
| UNITED RENTALS (NORTH AMERICA) 6%, due 12/15/2029 |
0.94% |
| HUNTINGTON INGALLS INDUSTRIES 0%, due 07/08/2026 |
0.91% |
| SMURFIT KAPPA TREASURY 5.20%, due 01/15/2030 |
0.86% |
| CONSTELLATION SOFTWARE 5.158%, due 02/16/2029 |
0.85% |
| BERRY GLOBAL INC 5.50%, due 04/15/2028 |
0.76% |
| QUANTA SERVICES INC 4.50%, due 01/15/2031 |
0.74% |
* Excluding cash.
Holdings are subject to change.
| Weighted Average Effective Duration8 | 2.97 Years |
| Weighted Average Maturity | 3.77 Years |
| Weighted Average Price | $99.17 |
| Weighted Average Coupon | 4.72% |
| Weighted Average Yield-to-Worst9 | 4.81% |
| Option-Adjusted Spread10 | 69 bps |
Portfolio information statistics exclude cash and other assets and liabilities. Weighted average maturity excludes defaulted assets. Bond yields are calculated as yield-to-worst and loan yields are calculated as yield-to-maturity. All yields are calculated on a weighted average basis which is the yield that would be earned, weighted by the value of each security in the fund's portfolio, if the security was held to maturity or to an earlier call date. The calculation does not include the effect of fund fees and expenses.
| Years |
Percent |
| Less than 6 Months |
3.81% |
| 1 Year |
9.89% |
| 2 Year |
19.10% |
| 3 Year |
22.67% |
| 4 Year |
15.63% |
| 5 Year |
15.24% |
| 7 Year |
10.62% |
| Greater than 7 Years |
2.79% |
| Term Loans |
0.25% |
| Credit Quality |
Percent |
| Cash & Equivalents |
1.36% |
| AA |
0.43% |
| AA- |
10.65% |
| A+ |
9.43% |
| A |
8.82% |
| A- |
8.34% |
| BBB+ |
17.03% |
| BBB |
18.08% |
| BBB- |
17.07% |
| BB+ |
5.30% |
| BB |
2.61% |
| BB- |
0.68% |
| B+ |
0.20% |
The ratings are by one or more nationally recognized statistical rating organizations (NRSROs), including S&P Global Ratings, Moody's Investors Service, Inc., Fitch Ratings, or a comparably rated NRSRO. For situations in which a security is rated by more than one NRSRO and the ratings are not equivalent, the highest rating is used. Ratings are measured highest to lowest on a scale that generally ranges from AAA to D for long-term ratings and A-1+ to C for short-term ratings. Investment grade is defined as those issuers that have a long-term credit rating of BBB- or higher or a short-term credit rating of A-3 or higher. "NR" indicates no rating. The credit ratings shown relate to the creditworthiness of the issuers of the underlying securities in the Fund, and not to the Fund or its shares. U.S. Treasury, U.S. Agency and U.S. Agency mortgage-backed securities appear under "Government & Agency". Credit ratings are subject to change.
|
|
2025 |
Q1 2026 |
Q2 2026 |
Q3 2026 |
| Days Traded at Premium |
224 |
59 |
58 |
0 |
| Days Traded at Discount |
26 |
2 |
4 |
4 |
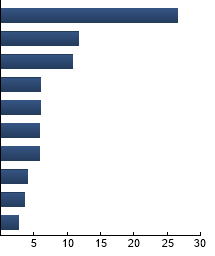
|
Banking
|
26.61%
|
|
Technology
|
11.71%
|
|
Healthcare
|
10.85%
|
|
Food & Beverage
|
6.02%
|
|
Construction Machinery & Manufacturing
|
5.93%
|
|
Insurance - Life and P&C
|
5.87%
|
|
Utilities
|
5.84%
|
|
Building Materials
|
4.10%
|
|
Paper & Packaging
|
3.58%
|
|
Asset Managers & Exchanges
|
2.75%
|
|
|
| |
Standard Deviation |
Alpha |
Beta |
Sharpe Ratio |
Correlation |
| FSIG |
2.60% |
-0.43 |
1.08 |
0.27 |
1.00 |
| Bloomberg US Corporate Bond 1-5 Year Index |
2.39% |
--- |
1.00 |
0.44 |
1.00 |
Standard Deviation is a measure of price variability (risk). Alpha is an indication of how much an investment outperforms or underperforms
on a risk-adjusted basis relative to its benchmark.Beta is a measure of price variability relative to the market. Sharpe Ratio is a measure
of excess reward per unit of volatility. Correlation is a measure of the similarity of performance.
Bloomberg US Aggregate Bond Index - The Index covers the investment-grade, U.S. dollar-denominated, fixed-rate taxable bond market, including Treasuries, government-related and corporate securities, MBS, ABS, and CMBS. Bloomberg US Corporate Bond 1-5 Year Index - The Index measures the investment grade, fixed-rate, taxable corporate bond market with 1-5 year maturities.
|
|
The information presented is not intended to constitute an investment recommendation for, or advice to, any specific person. By providing this information, First Trust is not undertaking to give advice in any fiduciary capacity within the meaning of ERISA, the Internal Revenue Code or any other regulatory framework. Financial professionals are responsible for evaluating investment risks independently and for exercising independent judgment in determining whether investments are appropriate for their clients.
|