|
|
 |
|
Investment Objective/Strategy - The First Trust S&P REIT Index Fund is an exchange-traded fund. This exchange-traded Fund seeks investment results that correspond generally to the price and yield (before the Fund's fees and expenses) of an equity index called the S&P United States REIT Index.
There can be no assurance that the Fund's investment objectives will be achieved.
-
The S&P United States REIT Index measures the investable U.S. real estate investment trust market and maintains a constituency that reflects the market's overall composition.
-
All securities added to the S&P United States REIT Index must meet certain liquidity and market capitalization requirements.
-
The Standard & Poor's Index Committee, a team of Standard & Poor's economists and index analysts, maintains the S&P United States REIT Index. Maintenance includes implementation of daily corporate actions, quarterly updates of significant events, and annual portfolio reconstitution each September. Share adjustments that exceed 5% are made at the time of the change. Share adjustments of less than 5% are made on a quarterly basis.
| Ticker | FRI |
| Fund Type | REIT |
| Investment Advisor | First Trust Advisors L.P. |
| Investor Servicing Agent | Bank of New York Mellon Corp |
| CUSIP | 33734G108 |
| ISIN | US33734G1085 |
| Intraday NAV | FRIIV |
| Fiscal Year-End | 12/31 |
| Exchange | NYSE Arca |
| Inception | 5/8/2007 |
| Inception Price | $20.00 |
| Inception NAV | $20.00 |
| Rebalance Frequency | Quarterly |
| Total Expense Ratio* | 0.49% |
| Net Expense Ratio* | 0.49% |
* As of 5/1/2025
Expenses are capped contractually at 0.50% per year, at least through April 30, 2026.
| Closing NAV1 | $28.37 |
| Closing Market Price2 | $28.38 |
| Bid/Ask Midpoint | $28.36 |
| Bid/Ask Discount | 0.04% |
| 30-Day Median Bid/Ask Spread3 | 0.07% |
| Total Net Assets | $157,427,380 |
| Outstanding Shares | 5,550,002 |
| Daily Volume | 21,559 |
| Average 30-Day Daily Volume | 20,033 |
| Closing Market Price 52-Week High/Low | $30.19 / $24.01 |
| Closing NAV 52-Week High/Low | $30.18 / $24.05 |
| Number of Holdings (excluding cash) | 135 |
| Holding |
Percent |
| Prologis, Inc. |
8.93% |
| Welltower Inc. |
8.77% |
| Equinix, Inc. |
6.54% |
| Simon Property Group, Inc. |
4.73% |
| Digital Realty Trust, Inc. |
4.63% |
| Realty Income Corporation |
4.55% |
| Public Storage |
3.90% |
| VICI Properties Inc. |
2.94% |
| Extra Space Storage Inc. |
2.64% |
| Ventas, Inc. |
2.63% |
* Excluding cash.
Holdings are subject to change.
Past performance is not indicative of future results.
 Among 210 funds in the Real Estate category. This fund was rated 4 stars/210 funds (3 years), 4 stars/193 funds (5 years), 3 stars/151 funds (10 years) based on risk adjusted returns.
| Maximum Market Cap. | $112,550 |
| Median Market Cap. | $2,710 |
| Minimum Market Cap. | $154 |
| Price/Earnings | 34.66 |
| Price/Book | 2.15 |
| Price/Cash Flow | 15.88 |
| Price/Sales | 6.72 |
|
|
2024 |
Q1 2025 |
Q2 2025 |
Q3 2025 |
| Days Traded at Premium |
172 |
15 |
21 |
34 |
| Days Traded at Discount |
80 |
45 |
41 |
17 |
|
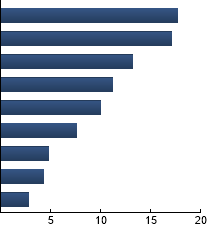
Health Care REITs
|
17.72%
|
|
Retail REITs
|
17.11%
|
|
Industrial REITs
|
13.20%
|
|
Data Center REITs
|
11.20%
|
|
Multi-Family Residential REITs
|
9.96%
|
|
Self-Storage REITs
|
7.55%
|
|
Single-Family Residential REITs
|
4.80%
|
|
Office REITs
|
4.34%
|
|
Hotel & Resort REITs
|
2.77%
|
|
|
| |
Standard Deviation |
Alpha |
Beta |
Sharpe Ratio |
Correlation |
| FRI |
18.58% |
-11.89 |
1.02 |
0.12 |
0.84 |
| FTSE EPRA/NAREIT North America Index |
18.68% |
-11.93 |
1.01 |
0.11 |
0.83 |
| Russell 3000® Index |
15.29% |
--- |
1.00 |
0.91 |
1.00 |
Standard Deviation is a measure of price variability (risk). Alpha is an indication of how much an investment outperforms or underperforms
on a risk-adjusted basis relative to its benchmark.Beta is a measure of price variability relative to the market. Sharpe Ratio is a measure
of excess reward per unit of volatility. Correlation is a measure of the similarity of performance.
FTSE EPRA/NAREIT North America Index - The Index is modified market cap weighted based on free float market capitalization and tracks the performance of listed real estate companies or REITs in North America. Russell 3000® Index - The Index is comprised of the 3000 largest and most liquid stocks based and traded in the U.S.
|
|
The information presented is not intended to constitute an investment recommendation for, or advice to, any specific person. By providing this information, First Trust is not undertaking to give advice in any fiduciary capacity within the meaning of ERISA, the Internal Revenue Code or any other regulatory framework. Financial professionals are responsible for evaluating investment risks independently and for exercising independent judgment in determining whether investments are appropriate for their clients.
|