|
|
 |
|
Investment Objective/Strategy - The First Trust NASDAQ Technology Dividend Index Fund is an exchange-traded fund. The Fund seeks investment results that correspond generally to the price and yield (before the Fund's fees and expenses) of an equity index called the Nasdaq Technology Dividend™ Index (the "Index").
There can be no assurance that the Fund's investment objectives will be achieved.
- To be included in the Index, the security must be listed on Nasdaq, Inc., the New York Stock Exchange, or the NYSE Amex and classified as a technology or telecommunications company according to Industry Classification Benchmark (ICB).
- Each security must have a minimum market capitalization of $500 million, have a minimum three-month average daily dollar trading volume of $1 million, have paid a regular or common dividend within the past 12 months; have a yield of at least 0.5%; have not had a decrease in common dividends per share paid within past 12 months; and may not be issued by an issuer currently in bankruptcy proceedings.
- The Index is evaluated semi-annually in March and September, but if at any time during the year other than the evaluation, an index security no longer meets the eligibility criteria, or is otherwise determined to have become ineligible for inclusion in the Index, the security is removed from the Index and is not replaced.
- The Index employs a modified dividend value weighting methodology. At each evaluation, the Index securities are classified as technology or telecommunications based on their ICB classification. The technology securities are given a collective weight of 80% and the telecommunications securities are given a collective weight of 20% in the index. The Index weighting methodology includes caps to prevent high concentrations among larger stocks.
- The Index is rebalanced quarterly.
| Ticker | TDIV |
| Fund Type | Technology |
| Investment Advisor | First Trust Advisors L.P. |
| Investor Servicing Agent | Bank of New York Mellon Corp |
| CUSIP | 33738R118 |
| ISIN | US33738R1187 |
| Intraday NAV | TDIVIV |
| Fiscal Year-End | 09/30 |
| Exchange | Nasdaq |
| Inception | 8/13/2012 |
| Inception Price | $19.92 |
| Inception NAV | $19.92 |
| Rebalance Frequency | Quarterly |
| Total Expense Ratio* | 0.50% |
* As of 2/2/2026
The Investment Advisor has implemented fee breakpoints, which reduce the fund's investment management fee at certain assets levels. Please see the fund's Statement of Additional Information for full details.
| Closing NAV1 | $117.61 |
| Closing Market Price2 | $117.63 |
| Bid/Ask Midpoint | $117.65 |
| Bid/Ask Premium | 0.03% |
| 30-Day Median Bid/Ask Spread (as of 6/18/2026)3 | 0.07% |
| Total Net Assets | $4,481,618,621 |
| Outstanding Shares | 38,105,000 |
| Daily Volume | 86,972 |
| Average 30-Day Daily Volume | 113,645 |
| Closing Market Price 52-Week High/Low | $128.33 / $87.01 |
| Closing NAV 52-Week High/Low | $128.36 / $87.08 |
| Number of Holdings (excluding cash) | 94 |
| Holding |
Percent |
| Broadcom Inc. |
7.68% |
| Texas Instruments Incorporated |
7.45% |
| Microsoft Corporation |
7.03% |
| International Business Machines Corporation |
6.98% |
| Oracle Corporation |
6.54% |
| Taiwan Semiconductor Manufacturing Company Limited (ADR) |
4.61% |
| QUALCOMM Incorporated |
3.76% |
| Analog Devices, Inc. |
3.06% |
| Applied Materials, Inc. |
2.94% |
| Cisco Systems, Inc. |
2.07% |
* Excluding cash.
Holdings are subject to change.
Past performance is not indicative of future results.
| Maximum Market Cap. | $3,344,578 |
| Median Market Cap. | $21,005 |
| Minimum Market Cap. | $882 |
| Price/Earnings | 25.41 |
| Price/Book | 5.64 |
| Price/Cash Flow | 15.92 |
| Price/Sales | 3.41 |
|
|
2025 |
Q1 2026 |
Q2 2026 |
Q3 2026 |
| Days Traded at Premium |
156 |
32 |
35 |
--- |
| Days Traded at Discount |
94 |
29 |
21 |
--- |
|
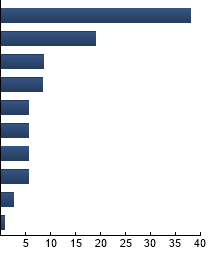
Semiconductors & Semiconductor Equipment
|
38.00%
|
|
Software
|
18.91%
|
|
IT Services
|
8.54%
|
|
Diversified Telecommunication Services
|
8.48%
|
|
Communications Equipment
|
5.64%
|
|
Electronic Equipment, Instruments & Components
|
5.62%
|
|
Technology Hardware, Storage & Peripherals
|
5.62%
|
|
Wireless Telecommunication Services
|
5.62%
|
|
Professional Services
|
2.56%
|
|
Interactive Media & Services
|
0.83%
|
|
|
Tracking Index: Nasdaq Technology Dividend™ Index
| |
Standard Deviation |
Alpha |
Beta |
Sharpe Ratio |
Correlation |
| TDIV |
18.69% |
3.22 |
1.28 |
1.38 |
0.91 |
| S&P 500® Information Technology Index |
21.60% |
3.25 |
1.41 |
1.30 |
0.87 |
| S&P 500® Index |
13.27% |
--- |
1.00 |
1.33 |
1.00 |
Standard Deviation is a measure of price variability (risk). Alpha is an indication of how much an investment outperforms or underperforms
on a risk-adjusted basis relative to its benchmark.Beta is a measure of price variability relative to the market. Sharpe Ratio is a measure
of excess reward per unit of volatility. Correlation is a measure of the similarity of performance.
S&P 500® Information Technology Index - The Index is an unmanaged index which includes the stocks in the information technology sector of the S&P 500 Index. S&P 500® Index - The Index is an unmanaged index of 500 companies used to measure large-cap U.S. stock market performance.
|
|
The information presented is not intended to constitute an investment recommendation for, or advice to, any specific person. By providing this information, First Trust is not undertaking to give advice in any fiduciary capacity within the meaning of ERISA, the Internal Revenue Code or any other regulatory framework. Financial professionals are responsible for evaluating investment risks independently and for exercising independent judgment in determining whether investments are appropriate for their clients.
|