Investment Objective/Strategy - The First Trust Enhanced Short Maturity ETF is an actively managed exchange-traded fund. The fund's investment objective is to seek current income, consistent with preservation of capital and daily liquidity.
There can be no assurance that the Fund's investment objectives will be achieved.
- The First Trust Enhanced Short Maturity ETF uses an actively managed strategy that invests in short-duration securities, which are primarily U.S. dollar-denominated, investment-grade securities.
- The fund will be invested across a broad range of asset classes to maintain diversification and at least 80% of the fund's assets will be investment-grade securities at the time of purchase.
- The fund will utilize a short-duration strategy that may offer the potential for enhanced income, while focusing on preservation of capital and daily liquidity.
| Ticker | FTSM |
| Fund Type | Short Maturity |
| Investment Advisor | First Trust Advisors L.P. |
| Investor Servicing Agent | Bank of New York Mellon Corp |
| CUSIP | 33739Q408 |
| ISIN | US33739Q4082 |
| Intraday NAV | FTSMIV |
| Fiscal Year-End | 10/31 |
| Exchange | Nasdaq |
| Inception | 8/5/2014 |
| Inception Price | $60.00 |
| Inception NAV | $60.00 |
| Total Expense Ratio* | 0.44% |
* As of 3/3/2025
The Investment Advisor has implemented fee breakpoints, which reduce the fund's investment management fee at certain assets levels. Please see the fund's Statement of Additional Information for full details.
| Closing NAV1 | $59.94 |
| Closing Market Price2 | $59.95 |
| Bid/Ask Midpoint | $59.96 |
| Bid/Ask Premium | 0.03% |
| 30-Day Median Bid/Ask Spread3 | 0.02% |
| Total Net Assets | $6,248,563,974 |
| Outstanding Shares | 104,249,724 |
| Daily Volume | 604,793 |
| Average 30-Day Daily Volume | 833,702 |
| Closing Market Price 52-Week High/Low | $60.15 / $59.72 |
| Closing NAV 52-Week High/Low | $60.15 / $59.73 |
| Number of Holdings (excluding cash) | 520 |
| Holding |
Percent |
| AUTONATION INC 0%, due 07/18/2025 |
1.05% |
| TARGA RESOURCES CORP 0%, due 07/18/2025 |
0.97% |
| U.S. Treasury Bill, 0%, due 07/22/2025 |
0.88% |
| ENERGY TRANSFER LP 0%, due 07/18/2025 |
0.81% |
| U.S. Treasury Bill, 0%, due 08/12/2025 |
0.72% |
| U.S. Treasury Bill, 0%, due 07/29/2025 |
0.69% |
| U.S. Treasury Note, 4.375%, due 07/15/2027 |
0.65% |
| CROWN CASTLE INC 4.45%, due 02/15/2026 |
0.56% |
| PLAINS ALL AMER PIPELINE 0%, due 07/18/2025 |
0.56% |
| WILLIAMS COMPANIES INC 4%, due 09/15/2025 |
0.56% |
* Excluding cash.
Holdings are subject to change.
|
Percent |
| Fixed-Rate Corporate Bonds |
46.64% |
| Commercial Paper |
23.45% |
| Asset Backed Securities |
16.94% |
| Government Bonds and Notes |
3.70% |
| Floating-Rate Corporate Bonds |
3.11% |
| Yankee CD |
2.57% |
| Commercial Mortgage Backed Securities |
1.66% |
| Mortgage Backed Securities |
1.61% |
| Collateralized Mortgage Obligation |
0.32% |
Past performance is not indicative of future results.
| Weighted Average Effective Duration8 | 0.67 Years |
| Weighted Average Maturity | 1.11 Years |
| Weighted Average Yield-to-Worst9 | 4.63% |
Calculated based on market value of invested assets plus settled cash position.
| Credit Quality |
Percent |
| Government & Agency |
5.19% |
| Cash |
0.00% |
| AAA |
18.06% |
| AA+ |
0.86% |
| AA |
2.40% |
| AA- |
6.32% |
| A+ |
3.51% |
| A |
4.04% |
| A- |
8.04% |
| BBB+ |
15.44% |
| BBB |
8.69% |
| BBB- |
3.61% |
| A-1 (short-term) |
6.31% |
| A-2 (short-term) |
16.25% |
| A-3 (short term) |
1.28% |
The ratings are by one or more nationally recognized statistical rating organizations (NRSROs), including S&P Global Ratings, Moody's Investors Service, Inc., Fitch Ratings, or a comparably rated NRSRO. For situations in which a security is rated by more than one NRSRO and the ratings are not equivalent, the highest rating is used. Ratings are measured highest to lowest on a scale that generally ranges from AAA to D for long-term ratings and A-1 to C for short-term ratings. Investment grade is defined as those issuers that have a long-term credit rating of BBB- or higher or a short-term credit rating of A-3 or higher. "NR" indicates no rating. The credit ratings shown relate to the creditworthiness of the issuers of the underlying securities in the Fund, and not to the Fund or its shares. U.S. Treasury, U.S. Agency and U.S. Agency mortgage-backed securities appear under "Government". Credit ratings are subject to change.
| Years |
Percent |
| 1-30 days |
26.32% |
| 31-90 days |
5.74% |
| 3-6 months |
8.31% |
| 6-12 months |
19.91% |
| 1-2 years |
27.59% |
| 2-3 years |
10.72% |
| >3 years |
1.41% |
|
|
2024 |
Q1 2025 |
Q2 2025 |
Q3 2025 |
| Days Traded at Premium |
97 |
42 |
36 |
4 |
| Days Traded at Discount |
155 |
18 |
26 |
8 |
|
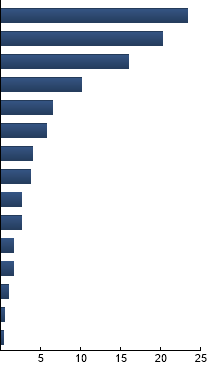
Financial
|
23.35%
|
|
Consumer, Non-cyclical
|
20.24%
|
|
ABS
|
15.96%
|
|
Industrial
|
10.17%
|
|
Technology
|
6.56%
|
|
Energy
|
5.71%
|
|
Consumer, Cyclical
|
4.04%
|
|
Government
|
3.70%
|
|
Utilities
|
2.67%
|
|
Communications
|
2.57%
|
|
CMBS
|
1.66%
|
|
Whole Loan
|
1.61%
|
|
CLO
|
0.97%
|
|
Basic Materials
|
0.47%
|
|
CMO
|
0.32%
|
|
|
| |
Standard Deviation |
Alpha |
Beta |
Sharpe Ratio |
Correlation |
| FTSM |
0.46% |
0.26 |
0.93 |
0.47 |
0.88 |
| ICE BofA 0-1 Year US Treasury Index |
0.48% |
--- |
1.00 |
-0.39 |
1.00 |
Standard Deviation is a measure of price variability (risk). Alpha is an indication of how much an investment outperforms or underperforms
on a risk-adjusted basis relative to its benchmark.Beta is a measure of price variability relative to the market. Sharpe Ratio is a measure
of excess reward per unit of volatility. Correlation is a measure of the similarity of performance.
Bloomberg US Aggregate Bond Index - The Index covers the investment-grade, U.S. dollar-denominated, fixed-rate taxable bond market, including Treasuries, government-related and corporate securities, MBS, ABS, and CMBS. ICE BofA 0-1 Year US Treasury Index - The Index is comprised of U.S. dollar denominated sovereign debt securities publicly issued by the U.S. Treasury in its domestic market with at least one month and less than one year remaining term to final maturity.
|
|