Investment Objective/Strategy - The First Trust Morningstar Dividend Leaders Index Fund is an exchange-traded index fund. The investment objective of the Fund is to replicate as closely as possible, before fees and expenses, the price and yield of the Morningstar® Dividend Leaders IndexSM.
There can be no assurance that the Fund's investment objectives will be achieved.
- Securities selected for the Morningstar® Dividend Leaders Index℠ are determined by a proprietary screening model developed by Morningstar. These securities have historically maintained consistent and sustainable dividend policies.
- The selection universe for this index is based on the Morningstar® US Market Index℠. Securities issuing dividend payments that do not constitute qualifying income (e.g., real estate investment trusts) are excluded.
- Based on forward looking earnings estimates and indicated dividends, stocks are eliminated from consideration if:
- The five-year indicated dividend per share growth is less than zero.
- One year estimated earnings per share divided by its indicated dividend per share is less than or equal to one.
- Remaining stocks are ranked by indicated dividend yield. The top 100 are selected for inclusion in the index.
- Index constituents are weighted based upon the dollar value of indicated dividend payments. Weightings are adjusted so that no individual security has greater than 10% weight, and securities with greater than 5% weight do not collectively exceed 50% of the index.
- The index is rebalanced quarterly and reconstituted annually.
| Ticker | FDL |
| Fund Type | Equity Income |
| Investment Advisor | First Trust Advisors L.P. |
| Investor Servicing Agent | Bank of New York Mellon Corp |
| CUSIP | 336917109 |
| ISIN | US3369171091 |
| Intraday NAV | FDLIV |
| Fiscal Year-End | 12/31 |
| Exchange | NYSE Arca |
| Inception | 3/9/2006 |
| Inception Price | $20.00 |
| Inception NAV | $20.00 |
| Rebalance Frequency | Quarterly |
| Total Expense Ratio* | 0.43% |
| Net Expense Ratio* | 0.43% |
* As of 5/1/2025
Expenses are capped contractually at 0.45% per year, at least through April 30, 2026.
The Investment Advisor has implemented fee breakpoints, which reduce the fund's investment management fee at certain assets levels. Please see the fund's Statement of Additional Information for full details.
| Closing NAV1 | $41.78 |
| Closing Market Price2 | $41.79 |
| Bid/Ask Midpoint | $41.77 |
| Bid/Ask Discount | 0.02% |
| 30-Day Median Bid/Ask Spread3 | 0.02% |
| Total Net Assets | $5,394,295,410 |
| Outstanding Shares | 129,100,002 |
| Daily Volume | 806,451 |
| Average 30-Day Daily Volume | 729,338 |
| Closing Market Price 52-Week High/Low | $43.95 / $37.66 |
| Closing NAV 52-Week High/Low | $43.92 / $37.67 |
| Number of Holdings (excluding cash) | 100 |
| Holding |
Percent |
| Exxon Mobil Corporation |
10.28% |
| Chevron Corporation |
7.36% |
| Verizon Communications Inc. |
7.20% |
| Pfizer Inc. |
6.41% |
| Merck & Co., Inc. |
5.34% |
| PepsiCo, Inc. |
4.90% |
| Altria Group, Inc. |
4.48% |
| Comcast Corporation (Class A) |
3.27% |
| United Parcel Service, Inc. (Class B) |
3.18% |
| Bristol-Myers Squibb Company |
3.11% |
* Excluding cash.
Holdings are subject to change.
Past performance is not indicative of future results.
 Among 1,089 funds in the Large Value category. This fund was rated 2 stars/1,089 funds (3 years), 4 stars/1,027 funds (5 years), 4 stars/815 funds (10 years) based on risk adjusted returns.
| Maximum Market Cap. | $328,745 |
| Median Market Cap. | $11,372 |
| Minimum Market Cap. | $1,942 |
| Price/Earnings | 15.96 |
| Price/Book | 1.77 |
| Price/Cash Flow | 9.10 |
| Price/Sales | 1.28 |
|
|
2024 |
Q1 2025 |
Q2 2025 |
Q3 2025 |
| Days Traded at Premium |
166 |
47 |
34 |
--- |
| Days Traded at Discount |
86 |
13 |
27 |
--- |
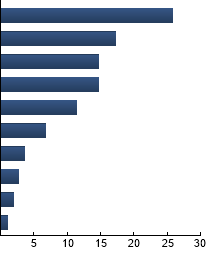
|
Energy
|
25.84%
|
|
Health Care
|
17.32%
|
|
Financials
|
14.69%
|
|
Consumer Staples
|
14.64%
|
|
Communication Services
|
11.46%
|
|
Utilities
|
6.79%
|
|
Industrials
|
3.61%
|
|
Consumer Discretionary
|
2.71%
|
|
Materials
|
1.95%
|
|
Information Technology
|
0.99%
|
|
|
Tracking Index: Morningstar® Dividend Leaders IndexSM
| |
Standard Deviation |
Alpha |
Beta |
Sharpe Ratio |
Correlation |
| FDL |
17.42% |
-4.46 |
0.80 |
0.23 |
0.76 |
| S&P 500® Index |
16.65% |
--- |
1.00 |
0.63 |
1.00 |
Standard Deviation is a measure of price variability (risk). Alpha is an indication of how much an investment outperforms or underperforms
on a risk-adjusted basis relative to its benchmark.Beta is a measure of price variability relative to the market. Sharpe Ratio is a measure
of excess reward per unit of volatility. Correlation is a measure of the similarity of performance.
Russell 1000® Value Index - The Index measures the performance of the large-cap value segment of the US equity universe. S&P 500® Index - The Index is an unmanaged index of 500 companies used to measure large-cap U.S. stock market performance.
|
|