Investment Objective/Strategy - The First Trust SSI Strategic Convertible Securities ETF is an actively managed exchange-traded fund that seeks to deliver total return by investing, under normal market conditions, at least 80% of its net assets in a diversified portfolio of U.S. and non-U.S. convertible securities.
There can be no assurance that the Fund's investment objectives will be achieved.
| Ticker | FCVT |
| Fund Type | Convertible Securities |
| Investment Advisor | First Trust Advisors L.P. |
| Investor Servicing Agent | Bank of New York Mellon Corp |
| Portfolio Manager/Sub-Advisor | SSI Investment Management LLC |
| CUSIP | 33739Q507 |
| ISIN | US33739Q5071 |
| Intraday NAV | FCVTIV |
| Fiscal Year-End | 10/31 |
| Exchange | Nasdaq |
| Inception | 11/3/2015 |
| Inception Price | $25.00 |
| Inception NAV | $25.00 |
| Total Expense Ratio* | 0.95% |
* As of 3/3/2025
| Closing NAV1 | $39.44 |
| Closing Market Price2 | $39.31 |
| Bid/Ask Midpoint | $39.36 |
| Bid/Ask Discount | 0.20% |
| 30-Day Median Bid/Ask Spread3 | 0.48% |
| Total Net Assets | $86,758,030 |
| Outstanding Shares | 2,200,002 |
| Daily Volume | 23,978 |
| Average 30-Day Daily Volume | 15,381 |
| Closing Market Price 52-Week High/Low | $39.31 / $32.51 |
| Closing NAV 52-Week High/Low | $39.44 / $32.48 |
| Number of Holdings (excluding cash) | 136 |
| Holding |
Percent |
| The Boeing Company, Convertible, 6.00%, Due 10/15/2027 |
3.47% |
| MICROSTRATEGY INC Convertible, 0%, due 12/01/2029 |
2.45% |
| NEXTERA ENERGY CAPITAL Convertible, 3%, due 03/01/2027 |
2.35% |
| MORGAN STANLEY FIN LLC Convertible, 0.125%, due 02/07/2028 |
2.20% |
| Bank of America Corporation, Series L, 7.25% |
1.69% |
| MICROSTRATEGY INC Convertible, 0%, due 03/01/2030 |
1.68% |
| SNOWFLAKE INC Convertible, 0%, due 10/01/2027 |
1.65% |
| Apollo Global Management, Inc., 6.75%, Due 07/31/2026 |
1.56% |
| Wells Fargo & Company, Series L, 7.500% |
1.51% |
| DIGITAL REALTY TRUST LP Convertible, 1.875%, due 11/15/2029 |
1.46% |
* Excluding cash.
Holdings are subject to change.
Past performance is not indicative of future results.
| Weighted Average Effective Duration4 | 1.26 Years |
|
Percent |
| Convertible Bond |
81.52% |
| Mandatory Preferred |
12.23% |
| Convertible Preferred |
3.13% |
| Cash & Equivalent |
3.12% |
|
|
2024 |
Q1 2025 |
Q2 2025 |
Q3 2025 |
| Days Traded at Premium |
28 |
14 |
25 |
1 |
| Days Traded at Discount |
224 |
46 |
37 |
8 |
|
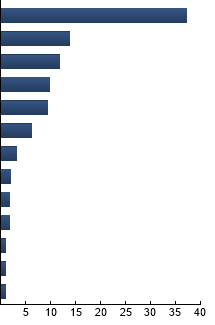
Technology
|
37.25%
|
|
Financials
|
13.73%
|
|
Consumer Discretionary
|
11.87%
|
|
Health Care
|
9.85%
|
|
Industrials
|
9.36%
|
|
Utilities
|
6.19%
|
|
Cash & Accrued Income
|
3.12%
|
|
Transportation
|
1.97%
|
|
Media
|
1.80%
|
|
Materials
|
1.77%
|
|
Telecommunications
|
1.06%
|
|
Consumer Staples
|
1.04%
|
|
Energy
|
0.99%
|
|
|
| |
Standard Deviation |
Alpha |
Beta |
Sharpe Ratio |
Correlation |
| FCVT |
12.64% |
-2.16 |
1.08 |
0.38 |
0.97 |
| ICE BofA US Convertible Index |
11.40% |
--- |
1.00 |
0.57 |
1.00 |
Standard Deviation is a measure of price variability (risk). Alpha is an indication of how much an investment outperforms or underperforms
on a risk-adjusted basis relative to its benchmark.Beta is a measure of price variability relative to the market. Sharpe Ratio is a measure
of excess reward per unit of volatility. Correlation is a measure of the similarity of performance.
Bloomberg US Aggregate Bond Index - The Index covers the investment-grade, U.S. dollar-denominated, fixed-rate taxable bond market, including Treasuries, government-related and corporate securities, MBS, ABS, and CMBS. ICE BofA US Convertible Index - The Index measures the return of all U.S. convertibles.
|
|