Investment Objective/Strategy - The Fund seeks investment results that correspond generally to the price and yield (before the Fund's fees and expenses) of an index called the Richard Bernstein Advisors American Industrial Renaissance® Index (the "Index"). The Fund will normally invest at least 90% of its net assets (plus the amount of any borrowings for investment purposes) in U.S. equity securities that comprise the Index. The Index is designed to measure the performance of small and mid cap U.S. companies in the industrial and community banking sectors.
There can be no assurance that the Fund's investment objectives will be achieved.
- The Richard Bernstein Advisors American Industrial Renaissance® Index is designed to measure the performance of small and mid cap U.S. companies in the industrial and community banking sectors.
- To construct the index, Richard Bernstein Advisors LLC (RBA) begins with the Russell 2500™ Index and eliminates companies not focused on infrastructure, manufacturing, transportation and related services such as banking.
- Banks will then be chosen from states considered to be traditional manufacturing hubs.
- To be eligible for inclusion in the index, companies must derive the majority of their revenues from the United States, therefore all securities issued by companies with non-U.S. sales greater than or equal to 25% are excluded. Additionally, securities must be issued by companies that have positive mean 12-months forward earnings consensus estimate.
- A security must meet the listing, share price minimum, size and liquidity standards of the index according to the index provider.
- RBA uses a proprietary portfolio optimization method to weight each individual constituent company.
- The index is reconstituted and rebalanced quarterly.
| Ticker | AIRR |
| Fund Type | Industrials |
| Investment Advisor | First Trust Advisors L.P. |
| Investor Servicing Agent | Bank of New York Mellon Corp |
| CUSIP | 33738R704 |
| ISIN | US33738R7044 |
| Intraday NAV | AIRRIV |
| Fiscal Year-End | 09/30 |
| Exchange | Nasdaq |
| Inception | 3/10/2014 |
| Inception Price | $19.98 |
| Inception NAV | $19.98 |
| Rebalance Frequency | Quarterly |
| Total Expense Ratio* | 0.70% |
* As of 2/3/2025
The Investment Advisor has implemented fee breakpoints, which reduce the fund's investment management fee at certain assets levels. Please see the fund's Statement of Additional Information for full details.
| Closing NAV1 | $85.10 |
| Closing Market Price2 | $85.12 |
| Bid/Ask Midpoint | $85.16 |
| Bid/Ask Premium | 0.06% |
| 30-Day Median Bid/Ask Spread3 | 0.06% |
| Total Net Assets | $4,259,225,954 |
| Outstanding Shares | 50,050,002 |
| Daily Volume | 1,337,564 |
| Average 30-Day Daily Volume | 430,642 |
| Closing Market Price 52-Week High/Low | $86.09 / $61.92 |
| Closing NAV 52-Week High/Low | $85.99 / $61.94 |
| Number of Holdings (excluding cash) | 56 |
| Holding |
Percent |
| Dycom Industries, Inc. |
3.34% |
| EMCOR Group, Inc. |
3.32% |
| BWX Technologies, Inc. |
3.10% |
| Primoris Services Corporation |
3.08% |
| Core & Main, Inc. (Class A) |
2.98% |
| Federal Signal Corporation |
2.92% |
| Huntington Ingalls Industries, Inc. |
2.80% |
| Advanced Drainage Systems, Inc. |
2.76% |
| Applied Industrial Technologies, Inc. |
2.68% |
| Granite Construction Incorporated |
2.67% |
* Excluding cash.
Holdings are subject to change.
Past performance is not indicative of future results.
 Among 46 funds in the Industrials category. This fund was rated 5 stars/46 funds (3 years), 5 stars/42 funds (5 years), 5 stars/33 funds (10 years) based on risk adjusted returns.
| Maximum Market Cap. | $23,941 |
| Median Market Cap. | $5,011 |
| Minimum Market Cap. | $445 |
| Price/Earnings | 23.62 |
| Price/Book | 2.88 |
| Price/Cash Flow | 14.21 |
| Price/Sales | 1.38 |
|
|
2024 |
Q1 2025 |
Q2 2025 |
Q3 2025 |
| Days Traded at Premium |
176 |
38 |
36 |
6 |
| Days Traded at Discount |
76 |
22 |
26 |
1 |
|
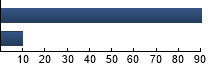
Industrials
|
90.25%
|
|
Financials
|
9.75%
|
|
|
Tracking Index: Richard Bernstein Advisors American Industrial Renaissance® Index
| |
Standard Deviation |
Alpha |
Beta |
Sharpe Ratio |
Correlation |
| AIRR |
27.85% |
15.47 |
1.23 |
0.92 |
0.92 |
| S&P 500® Industrials Index |
19.27% |
9.55 |
0.84 |
0.86 |
0.91 |
| Russell 2500™ Index |
20.91% |
--- |
1.00 |
0.40 |
1.00 |
Standard Deviation is a measure of price variability (risk). Alpha is an indication of how much an investment outperforms or underperforms
on a risk-adjusted basis relative to its benchmark.Beta is a measure of price variability relative to the market. Sharpe Ratio is a measure
of excess reward per unit of volatility. Correlation is a measure of the similarity of performance.
S&P 500® Industrials Index - The Index is an unmanaged index which includes the stocks in the industrials sector of the S&P 500 Index. Russell 2500™ Index - The Index is an unmanaged market-cap weighted index that includes the smallest 2,500 companies from the Russell 3000 Index. S&P 500® Index - The Index is an unmanaged index of 500 companies used to measure large-cap U.S. stock market performance.
|
|