-
2026 Estimated Capital Gain Distributions
Certain First Trust First Trust Exchange-Traded Funds are expected to pay a long-term capital gain distribution in December. For a list of exchange-traded funds expected to pay a long-term capital gain distribution, please click here. Also, certain First Trust Exchange-Traded Funds are expected to pay short-term capital gain distributions in December. For a list of exchange-traded funds expected to pay a short-term capital gain distribution, please click here. Final determination of the source and tax status of all distributions paid in the current year are to be made after year-end and could differ from the expectations noted above.
Investment Objective/Strategy - The First Trust Flexible Income ETF (the "Fund") seeks to maximize current income. Under normal circumstances, the Fund will seek to achieve its investment objective by investing in a portfolio of fixed income securities and instruments that generate income, including but not limited to corporate debt securities; bank loans; agency and non-agency residential and commercial mortgage-backed securities; asset-backed securities; collateralized loan obligations ("CLOs"); and preferred securities. Under normal market conditions, the Fund's average portfolio duration will vary between 0 to 8 years, although the Fund generally targets an average portfolio duration of 2 to 5 years. The Fund's investment advisor seeks to maximize the Fund's current income while pursuing attractive long-term total return by investing in a broad, diversified portfolio of fixed income securities and instruments that generate income, spanning the credit spectrum across various sectors, maturities, currencies, and geographies.
There can be no assurance that the Fund's investment objectives will be achieved.
| Ticker | FFLX |
| Fund Type | Taxable Fixed Income |
| Investment Advisor | First Trust Advisors L.P. |
| Investor Servicing Agent | Bank of New York Mellon Corp |
| Portfolio Manager/Sub-Advisor | Stonebridge Advisors LLC |
| CUSIP | 33740U257 |
| ISIN | US33740U2574 |
| Fiscal Year-End | 05/31 |
| Exchange | NYSE Arca |
| Inception | 5/25/2004 |
| Inception Price | $20.00 |
| Inception NAV | $19.10 |
| Total Expense Ratio* | 0.75% |
| Net Expense Ratio* | 0.65% |
* As of 10/1/2026
First Trust has contractually agreed to waive management fees of 0.10% of average daily net assets until September 30, 2027.
| Closing NAV1 | $9.49 |
| Closing Market Price2 | $9.49 |
| Bid/Ask Midpoint | $9.50 |
| Bid/Ask Premium | 0.11% |
| 30-Day Median Bid/Ask Spread (as of 11/10/2026)3 | 0.11% |
| Total Net Assets | $160,284,971 |
| Outstanding Shares | 16,883,390 |
| Daily Volume | 95,594 |
| Average 30-Day Daily Volume | 138,114 |
| Closing Market Price 52-Week High/Low | $10.11 / $9.36 |
| Closing NAV 52-Week High/Low | $10.36 / $9.40 |
| Number of Holdings (excluding cash) | 264 |
| Holding |
Percent |
| GNMA Series 2026-133, Class IO, Variable rate, due 04/16/2065 |
1.52% |
| GNMA G2 MA7366, 2%, due 05/20/2051 |
1.51% |
| GNMA TBA, 6%, due 05/01/2056 |
1.44% |
| Zayo Issuer LLC Series 2025-2A, Class C, 9.489%, due 06/20/2055 |
1.29% |
| Consolidated Communications LLC, Fidium Fiber Fina Series 2025-1A, Class C, 9.408%, due 05/20/2055 |
1.28% |
| GNMA G2 788892, 6%, due 10/20/2066 |
1.26% |
| Consolidated Communications LLC, Fidium Fiber Fina Series 2025-1A, Class B, 6.506%, due 05/20/2055 |
1.24% |
| Chase Mortgage Finance Corporation Series 2026-AGY2, Class A11, Variable rate, due 08/25/2057 |
1.22% |
| JP Morgan Mortgage Trust Series 2026-LTV1, Class A1, Variable rate, due 09/25/2056 |
1.18% |
| CIM Trust Series 2026-NR1, Class A1, Variable rate, due 07/25/2065 |
1.11% |
* Excluding cash.
Holdings are subject to change.
| Weighted Average Effective Duration (Long Positions)9 | 4.36 Years |
| Weighted Average Effective Duration (Short Positions)9 | -0.31 Years |
| Weighted Average Effective Net Duration9 | 4.05 Years |
| Weighted Average Yield-to-Worst10 | 6.65% |
| Bond Futures - Net | 19.65% |
| Options on Bond Futures - Net | 0.00% |
| Options on Interest Rate Futures - Net | 0.00% |
| TBAs - Short | -0.29% |
|
Percent |
| Corporate Bonds - IG |
22.92% |
| Corporate Bonds - HY |
17.49% |
| Non-Agency RMBS |
15.67% |
| ABS |
10.15% |
| Term Loans |
8.18% |
| TBAs - Long |
4.70% |
| Preferreds |
4.60% |
| CLOs |
4.19% |
| Non-Agency CMBS |
3.29% |
| Agency CMOs |
3.01% |
| Agency CMBS |
2.98% |
| Agency Pass-Throughs |
2.73% |
| Cash & Cash Equivalents |
0.09% |
| Agency Debt |
0.00% |
| Corporate Bonds - NR |
0.00% |
| ETFs |
0.00% |
Please note that percentage of 0.00 indicates an amount less than 0.01%.
| Credit Quality |
Percent |
| Cash & Cash Equivalents |
0.09% |
| Agency |
13.42% |
| AAA |
9.06% |
| AA+ |
0.29% |
| AA |
0.28% |
| AA- |
0.75% |
| A+ |
3.04% |
| A |
1.67% |
| A- |
2.64% |
| BBB+ |
5.52% |
| BBB |
11.68% |
| BBB- |
13.93% |
| BB+ |
5.96% |
| BB |
8.33% |
| BB- |
9.09% |
| B+ |
3.12% |
| B |
4.21% |
| B- |
1.79% |
| CCC+ |
0.98% |
| CCC |
0.02% |
| NR |
4.13% |
The ratings are by one or more nationally recognized statistical rating organizations (NRSROs), including S&P Global Ratings, Moody's Investors Service, Inc., Fitch Ratings, DBRS, Inc., Kroll Bond Rating Agency, Inc. or a comparably rated NRSRO. For situations in which a security is rated by more than one NRSRO and the ratings are not equivalent, the highest rating is used. A credit rating is an assessment provided by a NRSRO, of the creditworthiness of an issuer with respect to debt obligations. Ratings are measured on a scale that generally ranges from AAA (highest) to D (lowest). Investment grade is defined as those issuers that have a long-term credit rating of BBB- or higher. "NR" indicates no rating. The credit ratings shown relate to the creditworthiness of the issuers of the underlying securities in the fund, and not to the fund or its shares. U.S. Agency and U.S. Agency mortgage-backed securities appear under "Agency". Credit ratings are subject to change.
|
|
2025 |
Q1 2026 |
Q2 2026 |
Q3 2026 |
| Days Traded at Premium |
0 |
0 |
0 |
0 |
| Days Traded at Discount |
0 |
0 |
0 |
37 |
|
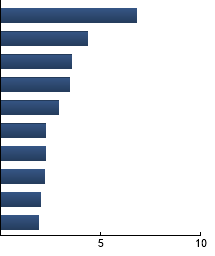
Banking
|
6.79%
|
|
Technology Services
|
4.35%
|
|
Software
|
3.57%
|
|
Healthcare Services
|
3.47%
|
|
Electric
|
2.90%
|
|
Media Entertainment
|
2.25%
|
|
Food
|
2.23%
|
|
Building Materials
|
2.21%
|
|
Cable Satellite
|
2.00%
|
|
P&C
|
1.89%
|
|
|
Bloomberg US Aggregate Bond Index - The Index covers the investment-grade, U.S. dollar-denominated, fixed-rate taxable bond market, including Treasuries, government-related and corporate securities, MBS, ABS, and CMBS. Morningstar® LSTA® US Leveraged Loan Index - The Index, formerly the S&P/LSTA Leveraged Loan Index, is a market value-weighted index that is designed to deliver comprehensive, precise coverage of the US leveraged loan market.
|
|